Summary
Process injection (T1055) is a well-known technique for evading detection, where malicious code is inserted into a legitimate process to disguise harmful activities as normal operations. Attackers frequently employ this method during both the initial and later stages of an attack. Additionally, process injection is commonly used to circumvent security measures, including antivirus software and advanced endpoint protection systems.
Process injection has traditionally been more popular on Windows compared to Linux due to its broader attack surface and injection-friendly model. However, there has been growing interest in Linux-based injections, with threat actors increasingly leveraging this technique.
This is where this module comes into play, offering an in-depth introduction to both local and remote process injection techniques on Linux, along with their detection opportunities. Upon completing this module, you will be able to:
- Understand the key
ELF structuresandprocfspseudo-files that are commonly involved in various process injection techniques. - Understand the role of ELF structures and sections such as the
PLT,GOT, andvDSO, how they operate, and how these can be hijacked whilebypassingpotential memory protections in place. - See how techniques such as
return address overwritingand stack-based hijacking, such asROP chains, commonly used in binary exploitation, can be more broadly applied to process injection and arbitrary code execution. - Understand how to use the powerful
ptracesyscall both offensively and defensively. - Design defensive Python scripts to automate detection of hijacking and control-flow corruption techniques.
- Understand how
auditdcan support detection and analysis of process injection techniques. - Understand various
kernel-level tracing mechanisms, and how to take advantage of them from user space.
The module also includes hands-on challenges to apply the acquired skills, and the final assessment is presented as an incident scenario in which you must demonstrate your critical thinking and ability to reconstruct a process injection operation.
The following prerequisites are highly recommended to comfortably follow this module:
- Completion of Introduction to Python 3
- Completion of Linux Fundamentals
- Completion of Intro to Assembly Language
- Completion of Stack-Based Buffer Overflows on Linux x86
- Completion of YARA & Sigma for SOC Analysts
- Completion of Understanding Log Sources and Investigating with Splunk
- A basic/good understanding of the C programming language and C structures.
Introduction
In terms of evasion and execution techniques, Process Injections on Linux have become very prevalent in the arsenal of advanced persistent threats (APTs) when it comes to attacking Linux terminals, systems, and servers. Indeed, Process Injection allows embedding malicious code into the memory space of a legitimate process, whether running or newly created, thereby bypassing potential endpoint protection tools and antivirus products that flag anomalous process spawns or monitor system calls, library calls, network activity, or filesystem activity for unknown/non-system processes.
Process injection has traditionally been more common on Windows, where the operating model, abstraction layers, and separation of concerns make its sub-techniques easier to implement. However, as noted in the MITRE ATT&CK framework under Technique T1055, this technique is also highly effective across Linux environments such as enterprise servers, cloud infrastructures, and IoT devices, where Linux deployments are far more widespread than Windows. As a result, understanding the different process injection detection methods on Linux and their detection opportunities has become essential for blue team-side crews, SOC analysts, detection engineers, threat researchers, and malware analysts.
To highlight the prevalence of process injection attacks on Linux systems, we can consider the 2020–2021 espionage campaign in which the Chinese-linked group UNC2630 (G1007, suspected ties to APT5) deployed the PACEMAKER malware. This malware uses the ptrace system call to attach to target processes and read their memory contents for credential exfiltration. Memory reading was performed via /proc/<pid>/mem to avoid using sensitive system calls such as process_vm_readv or the ptrace option PTRACE_PEEKDATA. Throughout this module, we will examine in detail, using practical examples, how these two techniques are carried out and which high/low-level mechanisms can support their detection.
Linux Telemetry Collection Mechanisms/Technologies
Telemetry Matters: Linux vs Windows
Linux stands out from Windows due to the richness and extensiveness of its telemetry, which is available at multiple abstraction levels of the operating system and easily accessible. This makes Linux particularly well-suited for comprehensive system monitoring. On Windows, a similar capability is offered by Event Tracing for Windows (ETW), which provides a powerful framework for collecting detailed events across the system, including system calls, network activity, file access, and process manipulation. However, ETW has significant limitations when it comes to capturing raw syscalls. For instance, ETW-TI, one of the few providers reporting parameters for sensitive syscalls like memory manipulation or thread creation, requires a Microsoft-signed consumer and an ELAM driver, and both of which must pass WHQL testing processes, making it complex and largely inaccessible for individual users wishing to implement telemetry collection mechanisms for security monitoring by themselves.
For simpler user-mode syscall capture, Windows security products often rely on more invasive techniques, such as hooking functions at the ntdll.dll level, which implements syscall instructions, to redirect execution flow toward analysis routines embedded in DLLs injected by the security product. This approach of active, invasive monitoring is common in endpoint security solutions that are also operating at the user-mode level.
In contrast, Linux allows syscall interception easily, efficiently, and with minimal overhead through several kernel-integrated mechanisms, without affecting process performance. Even for complex advanced tasks like developing eBPF kernel modules, Linux provides open-source access, extensive documentation, and numerous community examples and projects, offering a clear advantage over Windows in terms of flexibility and accessibility for deep monitoring and telemetry for security purposes.
The Hack The Box Academy modules, Windows Kernel Telemetry & Detection Techniques and Windows Low-Level Detectability highlight the full range of telemetry capabilities from an extremely low-level perspective, covering both the kernel and user-space layers of the Windows operating system.
Linux Telemetry Collection Mechanisms
As discussed earlier, the Linux kernel offers a wide range of telemetry collection mechanisms for deep visibility into the operating system activity, ranging from kernel-level events to user-level ones. The following table summarizes some of these technologies, their purpose, and common tools used to interact with them:
| Technology/Mechanism | Description | Tools for Interaction |
|---|---|---|
eBPF (extended Berkeley Packet Filter) |
A revolutionary technology that allows sandboxed programs to run in the Linux kernel without changing the kernel source code or loading kernel modules. Provides safe, efficient, and low-overhead observability. | BCC (BPF Compiler Collection): Tools for BPF-based Linux IO analysis, networking, monitoring.bpftrace: High-level tracing language for Linux.Falco: Cloud-native security tool for runtime threat detection. Cilium: eBPF-based networking, security, and observability. Pixie: Kubernetes observability platform. Tracee: eBPF threat dectection engine. |
Kprobes |
A kernel debugging mechanism that allows dynamic breakpoints anywhere in the kernel (except marked areas). It can instrument function entry (kprobes) and return (kretprobes) . | SystemTap: Script-based tracing and probing tool that can use kprobes. perf-probe: Command to define dynamic tracepoints using kprobes. BCC tools: Many tools in the BCC collection rely on kprobes. |
Kernel Tracepoints |
Static instrumentation points are placed at strategic locations in the kernel code. They have a stable ABI and a lower performance impact compared to dynamic probes but are limited to predefined locations. | perf: The Linux performance counter subsystem that can record and analyze tracepoints.trace-cmd: A front-end for the Ftrace kernel tracer, which uses tracepoints.LTTng: A tracing framework that efficiently collects kernel tracepoints. |
Auditd (Linux Audit Framework) |
A subsystem that logs security-relevant events at the system call level. It provides detailed, configurable audit trails for compliance and security monitoring. | auditctl: Utility to control the audit daemon's behavior and add rules.ausearch: Tool to query the audit daemon logs.aureport: Tool to generate summary reports from audit logs. |
Ftrace |
A built-in Linux kernel tracer designed to help developers discover what is happening inside the kernel. It is particularly useful for tracing the flow of functions and interrupts. | trace-cmd: Command-line interface for Ftrace.Kernel debugfs: Direct interaction via the /sys/kernel/debug/tracing directory. |
perf_events |
The Linux performance counter subsystem, which provides a rich set of tools for monitoring hardware performance counters, software events, and tracepoints. | perf: The main command-line tool for performance analysis (perf stat, perf record, perf report). |
Uprobes |
The user-space equivalent of kprobes allows dynamic instrumentation of user-space applications at function entry and return points. | SystemTap: Supports user-space probing via uprobes.perf probe: Can define dynamic tracepoints in user applications.GDB: The GNU Debugger can use similar mechanisms. |
Linux Security Modules (LSM) |
A framework that provides hooks for security modules to enforce mandatory access control policies in the Linux kernel (e.g., SELinux, AppArmor). |
SELinux: Security-Enhanced Linux.AppArmor: Application Armor.getenforce/setenforce: Commands to control SELinux state. |
Module Lab
The Ubuntu VM ACADEMY-LINUX-PROCINJECT accompanies this module and will be used to follow all the steps presented throughout it by connecting via SSH.
All the resources you need, which will be used throughout this module, are located in the /home/lab_adm/htb/ directory. The user lab_adm has sudo privileges. Each section specifies the exact path of the resources used at the beginning of the section. The protections-artifacts folder is a clone of the Elastic repository. The /protections-artifacts/yara/rules/ directory contains only the YARA rules from the repository that are applicable to Linux.
├── htb
│   ├── challenges
│   ├── elf_101
│   ├── fileless
│   ├── got_hijack
│   ├── inotify
│   ├── ld_preload
│   ├── PANIX
│   ├── plt_hijack
│   ├── ptrace
│   ├── ret_hijack
│   ├── rop
│   ├── skills-assessment
│   ├── tracepoints
│   ├── utils
│   ├── vdso_hijack
├── protections-artifacts
│   ├── behavior
│   ├── LICENSE.txt
│   ├── ransomware
│   ├── README.md
│   └── yara
└── splunk
Splunk Instance
The lab also includes a Splunk instance accessible on port 8000 of the lab VM that accompanies this module, which you will also need for the Skills Assessment part. You have admin rights on the instance, which you can connect to directly as an administrator.
Splunk is configured to index both /var/log/audit/audit.log, the default logging file for auditd, and /home/lab_adm/htb/skills-assessment/incident_auditd_logs.txt, which you will need for the skills assessment at the end of the module.
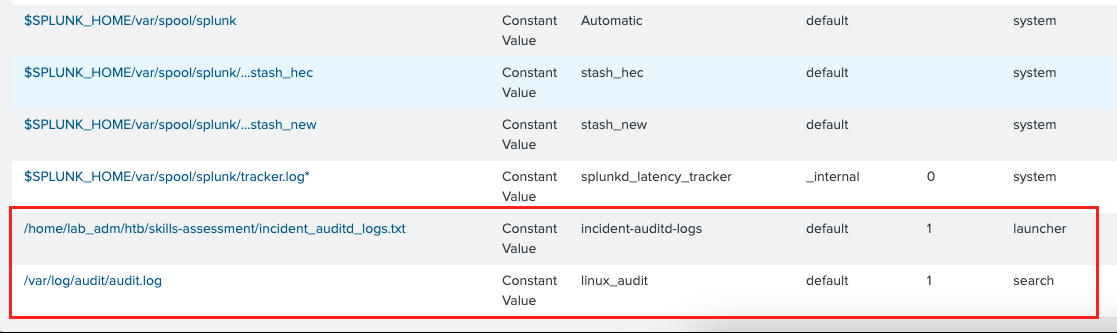
You can add or modify indexed files from Settings -> Data Inputs -> Files & Directories.
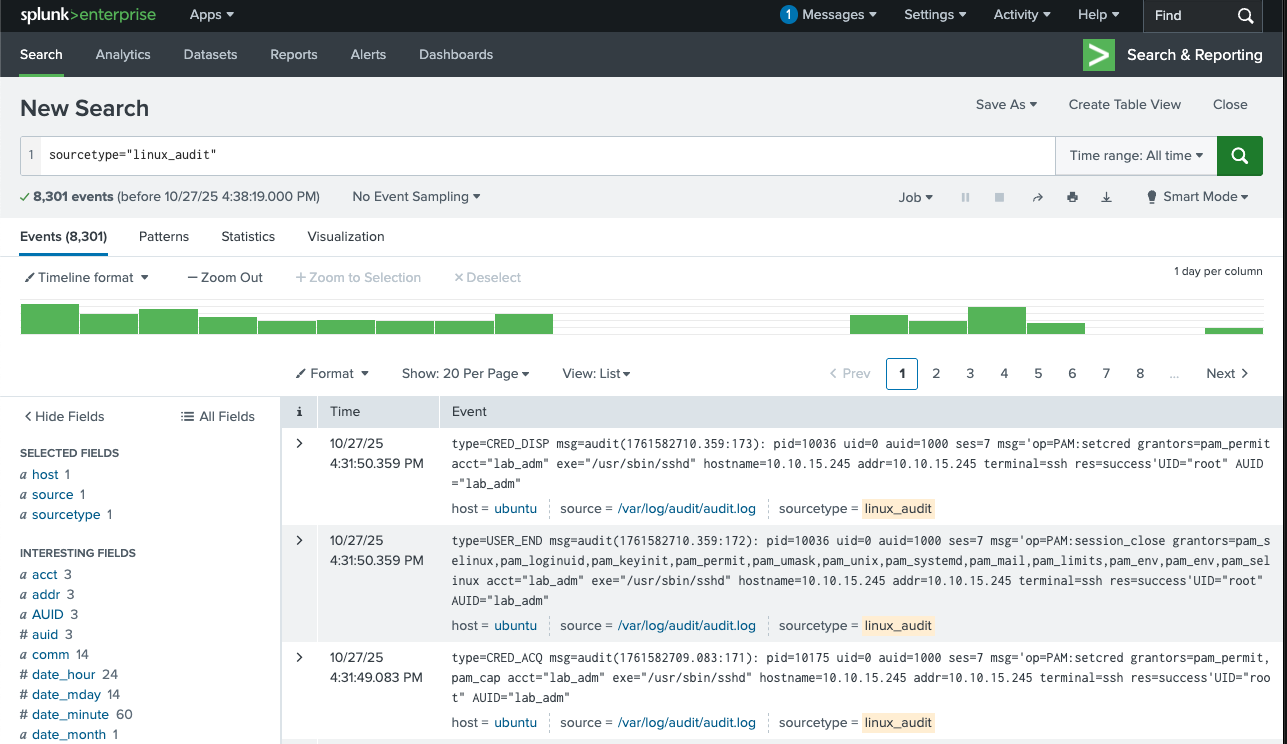
You can thus perform a search on the indexed files from the Splunk home page -> Search & Reporting.
Note that this module assumes you already have some experience with the C programming language, a basic understanding of debugging and GDB, and that you have completed the modules listed in the preface.