Summary
Throughout this module, we'll explore various ways of gathering and processing metrics-oriented information offered by the Windows kernel. We'll start by looking at how to access and comprehensively process information provided by kernel ETW (Event Tracing for Windows) providers, such as Microsoft Threat Intelligence (TI), and how we can use this information to help build simple detection logic for various TTPs, such as code injection techniques, thread hijacking, or credential dumping. We'll then delve into the Windows NT kernel and see how structures such as Virtual Address Descriptors (VAD) and kernel executive layer structures can be coupled with the powerful callback mechanisms to detect anomalies in process behavior, enabling us to detect malicious operations such as PPID spoofing, process hollowing, illegitimate handle operations, and so on.
We'll also look at how to detect beacons, code injectors, and C2 artifacts behaviors from a kernel perspective, and see how we can take advantage of shadow stacks to detect thread call stack anomalies.
This module will also demonstrate how system calls can be intercepted and examined directly from the kernel at the moment they are triggered by user-space applications, before their processing by the kernel, offering an in-depth understanding of the system's behavior. We will also explore how these calls can be monitored, analyzed and manipulated at the kernel level.
Additionally, the module introduces the concept of filter drivers, focusing on the two most common types: minifilter drivers, which monitor file system activity including NTFS and NPFS operations such as named pipe interactions, and network filter drivers that use the Windows Filtering Platform (WFP) to inspect and control TCP/IP traffic.
Through minifilter drivers, we will learn how to monitor user and process interactions with the file system, such as file creation, access, modification, and deletion, and how to leverage kernel's visibility to detect local privilege escalation techniques, among other things. On the networking side, we will examine how WFP-based drivers can intercept and filter TCP/IP traffic directly from the kernel, providing rich telemetry that supports the design of more precise detection strategies and reduces the risk of false positives.
The module goes beyond the defensive aspect by also demonstrating how attackers can abuse specific privileges to disable/neutralize kernel telemetry sources and evade detection by security tools that depend on them, including ETW, filter drivers, and callback mechanisms.
In a similar fashion to security and endpoint protection solutions such as Endpoint Detection & Response (EDRs), which heavily rely on telemetry provided by the Windows kernel, we'll develop our experimental drivers and deploy them in a test environment connected to our WinDbg kernel debugger.
This module addresses blue/red teamers, security engineers, and developers wishing to learn more about Windows metrics collection mechanisms from a kernel point of view.
Throughout this module, learners will gain in-depth knowledge and hands-on experience with the following topics:
-
Practical Windows User/Kernel C++ Programming, allowing to harness the full power of ETW and the kernel’s native telemetry and monitoring infrastructure, while gaining hands-on experience developing defensive artifacts. -
Kernel-level notification mechanisms, covering process, thread, registry, image load, and object handle callbacks, while showing how to combine them with kernel structures to design effective detection methodologies. -
Exploration of low-level interception methods, including undocumented kernel-level techniques for monitoring and intercepting system calls on Windows 10. -
File system monitoring with Minifilter drivers, enabling interception and control of file and named pipe operations on NT File System (NTFS) and Named Pipe File System (NPFS). -
Network traffic control with filtering drivers, achieved through the development of custom drivers that inspect and control TCP/IP flows using the Windows Filtering Platform (WFP). -
Static/Dynamic analysis of kernel structures and components, including ETW and filtering driver internals, along with a dynamic exploration ofWdFilter.sys, a filtering driver belonging to Windows Defender. -
Advanced detection techniques, leveraging internal kernel structures alongside modern exploit mitigation technologies such as Control-Flow Enforcement Technology (CET). -
Kernel monitoring from both attacker and defender perspectives, exploring how adversaries manipulate/neutralize callbacks and manage to disable ETW.
All defensive techniques presented in this module are mapped to the MITRE D3FEND framework.
In order to follow this module with ease, the following prerequisites are highly recommended:
- Completion of
Process Injection Attacks and Detection - Completion of
Introduction to Dynamic Analysis with WinDbg - Completion of
Intro to Assembly Language - A good understanding of C/C++, pointers and structures
- A general understanding of the Win32 API and an idea of how processes and threads work on Windows
- Basic understanding of the Portable Executable (PE) format and its components
Introduction
Security solution vendors, such as those developing Endpoint Detection and Response (EDR) tools, implement their own unique detection logic. This logic is a key differentiator between products and a major factor in industry competition. Although many telemetry sources are accessible, their coverage and granularity can differ greatly. The richer and more detailed the telemetry, the more accurate and reliable the detection logic, ultimately helping to minimize false positives.
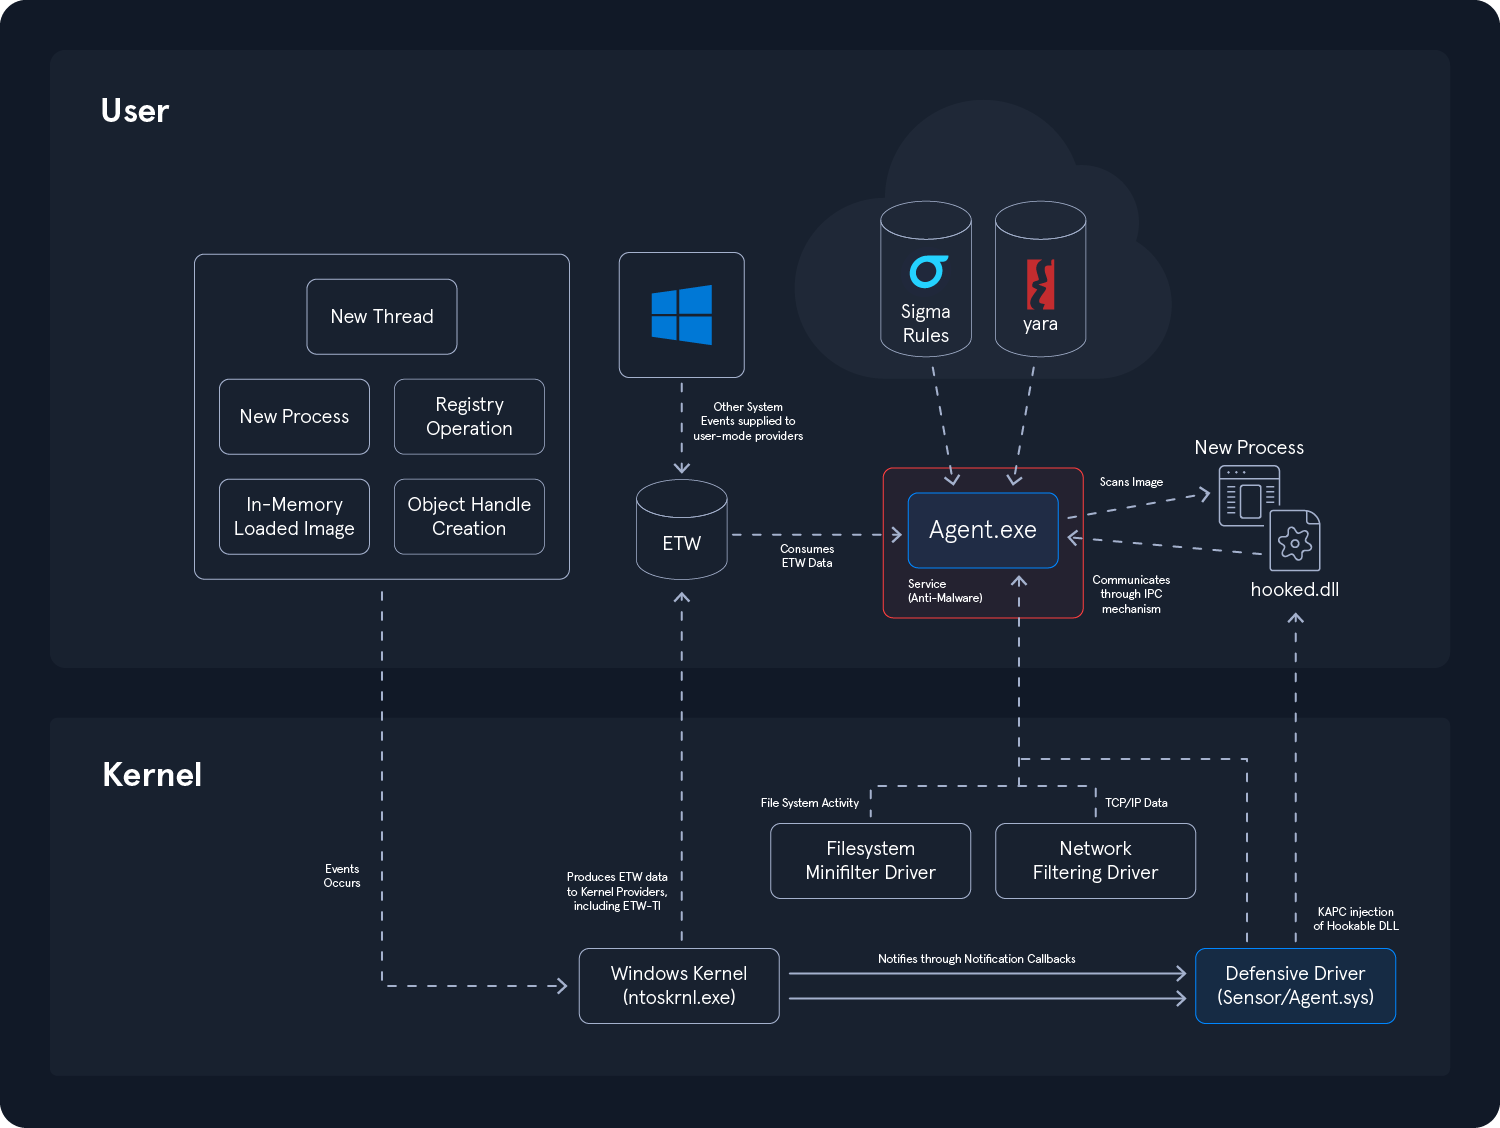
The diagram below illustrates a small portion of an architecture focused on gathering telemetry from various sources on Windows. The two main components of the security product are the defensive driver operating in the kernel and the user-mode process attached to a service. In addition to this, the security product includes two filtering drivers that are also present in the kernel:
Telemetry Sources
The telemetry sources shown here are typical of those that an EDR can leverage to enrich its detection logic and make decisions regarding the legitimacy of a process, an action, or any system event. All of these entities provide telemetry data to the agent, which is responsible for making the final decision. Here, we can identify several entities:
-
Kernel notifications are delivered to a
defensive driverthrough registered notification callbacks. These allow the driver to be notified when critical events occur, such as onthread or process creation,in-memory image loading/mapping,handle operations on objects, orregistry modifications. -
The defensive driver can also initiate the
injection of a DLLinto certain newly created processes in order to intercept critical user-mode API calls that are commonly used in malicious activities. This injection is typically carried out throughKernel Asynchronous Procedure Call (KAPC). While once widely used, this method is becoming less popular due to its user-mode nature, which makes it fragile by design. -
The security agent also relies on
knowledge bases, includingYaraandSigmarules, which are most often decentralized. These rule sets are leveraged at runtime to scan memory images or process behavior, allowing the agent to correlate telemetry data with known indicators or behavioral patterns. -
ETW (Event Tracing for Windows)is a rich and powerful telemetry source that covers a wide range of events in Windows. Depending on its detection logic, a consumer can subscribe to variousETW providersto collect relevant information and enrich the telemetry that makes up its detection logic. -
A
Network Filtering Driveroperating at theNDISlayer is responsible for capturing and dispatching data related to network traffic. It can alsofilter,interrupt, orblocktraffic. This driver enriches telemetry with network information, enhancing detection accuracy by correlating with threat intelligence sources, such as databases of known malicious IP addresses, like command and control servers or known phishing domains. -
A
File System Filteringdriver that monitors and controls file systems activity on Windows, specificallyNTFS, which stands for NT File System, and Named Pipes monitoring through the Named Pipe File System (NPFS). This type of driver can monitorfilesthat arecreated,opened,modified,deleted, and more, making it very useful for analyzing the activity of an attacker or a malicious process interacting with the file system. It can also monitor operations related topipe objects, anInterprocess Communication Mechanism (IPC)frequently used by certain malicious artifacts, such as during privilege escalation.
Easily recognizable malicious behavior does not always require deep analysis of telemetry data. In many cases, simple implementations are sufficient to detect multiple behavior variations. These are the techniques we will focus on throughout this module, which introduces and gradually reveals the various capacities of the Windows kernel when it comes to providing telemetry for defensive purposes.
Detection Rules
More complex behaviors may require a behavior description language, such as Sigma rules. For better understanding, let us consider a concrete example. The following Sigma rules are designed to detect activity associated with the BlackByte ransomware. They originate from the Sigma project repository on GitHub.
Detection based on Registry Operations
The first rule mentioned below aims to identify registry operations that are similar to those performed by the ransomware:
title: Blackbyte Ransomware Registry
id: 83314318-052a-4c90-a1ad-660ece38d276
status: test
description: BlackByte set three different registry values to escalate privileges and begin setting the stage for lateral movement and encryption
references:
    - https://redcanary.com/blog/blackbyte-ransomware/?utm_source=twitter&utm_medium=social
    - https://www.trustwave.com/en-us/resources/blogs/spiderlabs-blog/blackbyte-ransomware-pt-1-in-depth-analysis/
author: frack113
date: 2022-01-24
modified: 2023-08-17
tags:
    - attack.defense-evasion
    - attack.t1112
logsource:
    category: registry_set
    product: windows
detection:
    selection:
        TargetObject:
            - HKLM\SOFTWARE\Microsoft\Windows\CurrentVersion\Policies\System\LocalAccountTokenFilterPolicy
            - HKLM\SOFTWARE\Microsoft\Windows\CurrentVersion\Policies\System\EnableLinkedConnections
            - HKLM\SYSTEM\CurrentControlSet\Control\FileSystem\LongPathsEnabled
        Details: DWORD (0x00000001)
    condition: selection
falsepositives:
    - Unknown
level: high
The rule defines a detection pattern based on the modification of three registry key values, setting them to 0x1. Such registry changes can be detected at two levels: either by leveraging kernel callbacks to be notified each time a registry operation occurs, or through a dedicated ETW provider such as Microsoft-Windows-Kernel-Registry. The agent can collect this data via the callback, detect that the registry behavior matches that of BlackByte's activity, and improve its detection accuracy by identifying additional behaviors specific to the ransomware. This also helps reduce the risk of false positives, which is an important aspect when automating detection tactics.
Detection based on Process Creation Activity
The second Sigma rule aims to detect potential BlackByte activity by identifying suspicious command line patterns and behaviors commonly associated with its execution, such as disabling system utilities, decoding base64 commands, or launching processes from unusual directories:
title: Potential BlackByte Ransomware Activity
id: 999e8307-a775-4d5f-addc-4855632335be
status: test
description: Detects command line patterns used by BlackByte ransomware in different operations
references:
    - https://redcanary.com/blog/blackbyte-ransomware/
author: Florian Roth (Nextron Systems)
date: 2022-02-25
modified: 2023-02-08
tags:
    - attack.execution
    - attack.defense-evasion
    - attack.impact
    - attack.t1485
    - attack.t1498
    - attack.t1059.001
    - attack.t1140
    - detection.emerging-threats
logsource:
    category: process_creation
    product: windows
detection:
    selection_1:
        Image|startswith: 'C:\Users\Public\'
        CommandLine|contains: ' -single '
    selection_2:
        CommandLine|contains:
            - 'del C:\Windows\System32\Taskmgr.exe'
            - ';Set-Service -StartupType Disabled $'
            - 'powershell -command "$x =[System.Text.Encoding]::Unicode.GetString([System.Convert]::FromBase64String('
            - ' do start wordpad.exe /p '
    condition: 1 of selection_*
falsepositives:
    - Unknown
level: high
The goal of a security product relying on this rule is to inspect both the path and command line of certain processes. Specifically, we want to check if a process is launched from the C:\Users\Public\ directory and whether its command line contains specific strings. To achieve this, we can simply rely on the Microsoft-Windows-Kernel-Process ETW Provider or leverage a process creation notification callback at the kernel level.
The following structure is an example of returned data when such a callback is triggered; it contains the CommandLine member, which informs the agent about the command line of the newly created process, as well as the FileObject member, which provides its location under the file system.
typedef struct _PS_CREATE_NOTIFY_INFO {
  SIZE_T              Size;
  union {
    ULONG Flags;
    struct {
      ULONG FileOpenNameAvailable : 1;
      ULONG IsSubsystemProcess : 1;
      ULONG Reserved : 30;
    };
  };
  HANDLE              ParentProcessId;
  CLIENT_ID           CreatingThreadId;
  struct _FILE_OBJECT *FileObject;      <---
  PCUNICODE_STRING    ImageFileName;
  PCUNICODE_STRING    CommandLine;      <---
  NTSTATUS            CreationStatus;
} PS_CREATE_NOTIFY_INFO, *PPS_CREATE_NOTIFY_INFO;
This data is then processed by the agent, which maps it against the Sigma rule and decides what action to take next depending on its detection logic.
In addition to that, the command del C:\Windows\System32\Taskmgr.exe explicitly implies an attempt to delete the Windows Task Manager. This is a File System operation of type deletion, which can be detected, reported, and filtered using a File System filtering driver.
In short, the agent correlates all available data and contextual information to determine whether a threat is present. A match with a rule or set of rules may not immediately be fatal for a process. Instead, the security product will incrementally increase the process’s risk level until it reaches a defined threshold, at which point the product’s logic will classify the process as malicious and decide to terminate and report it.
Increasingly, vendors are also leveraging artificial intelligence to enhance their detection logic. However, the effectiveness of these models depends heavily on the quality of the telemetry data that is constantly used for training them. If the telemetry data lacks depth, accuracy, or diversity, the models will likely struggle to identify complex or emerging threats.
MITRE D3FEND Mappings
Throughout this module, we will also map the defensive methods we implement to the MITRE D3FEND matrix. Here are some of the mapped defensive techniques that will be covered:
-
Process Spawn Analysis(D3-PSA) -
Shadow Stack Comparisons(D3-SSC) -
System Call Analysis(D3-SCA) -
Process Self-Modification Detection(D3-PSMD) -
File Hashing(D3-FH) -
File Integrity Monitoring(D3-FIM) -
Connection Attempt Analysis(D3-CAA) -
IPC Traffic Analysis(D3-IPCTA) -
File Content Analysis(D3-FCOA) -
File Access Pattern Analysis(D3-FAPA) -
System File Analysis(D3-SFA) -
Process Code Segment Verification(D3-PCSV) -
Process Lineage Analysis(D3-PLA) -
Memory Boundary Tracking(D3-MBT) -
Network Traffic Filtering(D3-NTF) -
Inbound Traffic Filtering(D3-ITF) -
Outbound Traffic Filtering(D3-OTF)
For each defensive technique mapped to MITRE D3FEND, we can view the corresponding MITRE ATT&CK techniques it aims to address. For instance, with the defensive technique Process Self-Modification Detection (D3-PSMD), we can see the associated ATT&CK TTPs that it helps detect or mitigate.
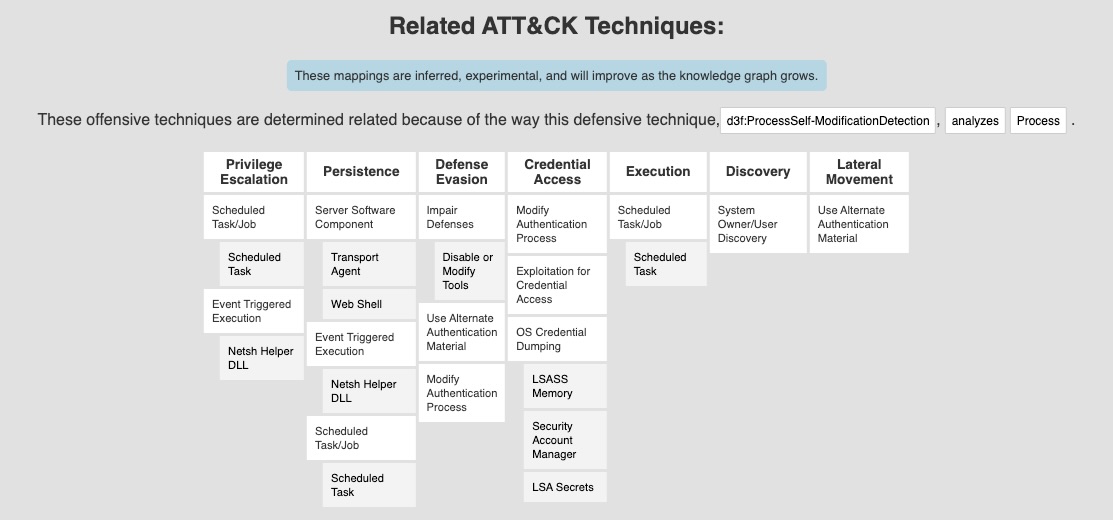
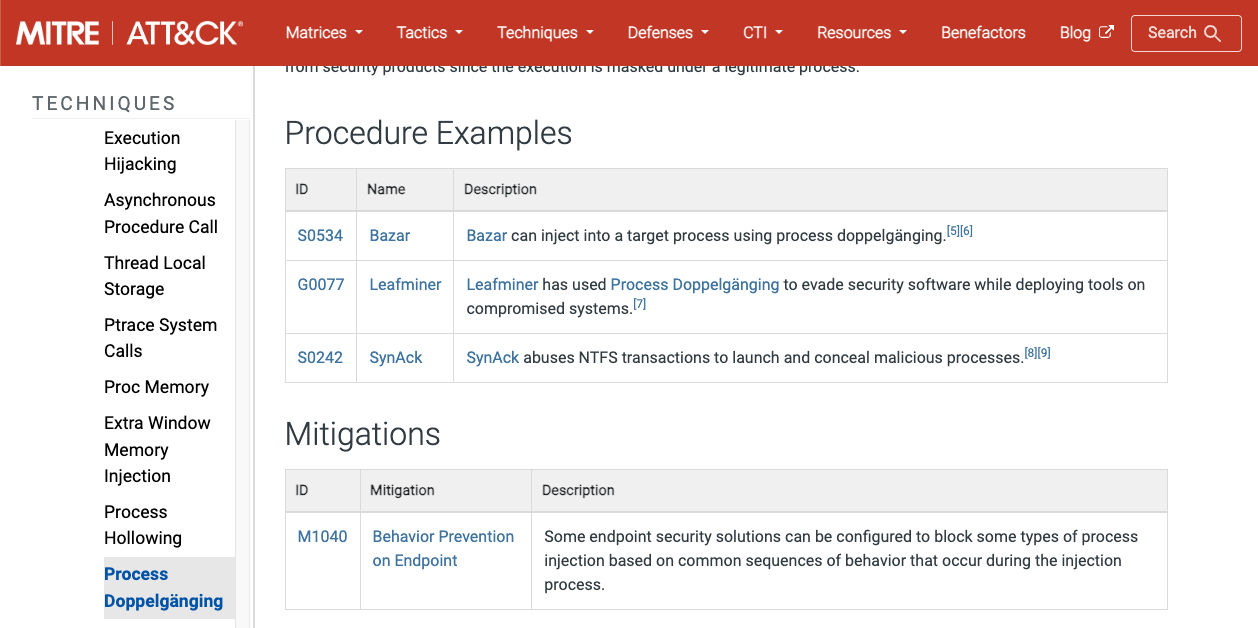
Take the time to review the description of each defensive technique in the MITRE D3FEND matrix that we will map to the implementations covered in this module. Each entry includes the related MITRE ATT&CK techniques, offering a clear view of the threats being addressed. These entries also provide real-world examples. For instance, the entry for the Process Doppelgänging technique includes a detailed explanation, associated ATT&CK mappings, and real-world usage scenarios:
Module Labs
Two target machines are provided in the lab environment for this module. Both are pre-configured Windows 10 22H2 virtual machines running in test signing mode so that drivers can be loaded without having to be signed:
-
Development Machine (
ACADEMY-KERNELTELEM-DEV): This refers to the development machine used to perform kernel debugging on the test machine. It is the one being referred to whenever "development machine" is mentioned. This machine includes tools such asVisual Studio,WinDbg,IDA,System Informer, andETW Explorer. This is the machine that will be used for developing defensive kernel drivers and artifacts that interact with ETW. All tools and artifacts related to this machine are located in itsC:\Kernel-Telemetry-Devdirectory. -
Testing Machine (
ACADEMY-KERNELTELEM-TEST): This is the test machine, where we will deploy and test defensive drivers along with all related artifacts. It comes withSystem InformerandWinDbgpre-installed. All tools and artifacts related to this machine are located in theC:\Kernel-Telemetry-Testdirectory.

Therefore, when referring to a file or artifact located in C:\Kernel-Telemetry-Dev\, it will be understood to be on the development machine; if it is in C:\Kernel-Telemetry-Test\, it will be assumed to be on the test machine.
You will have access to the complete source code for all examples demonstrated in this module, organized into individual projects under two Visual Studio solutions on the development machine:
-
ETW-Artefacts: located atC:\Kernel-Telemetry-Dev\ETW-Artefacts\ETW-Artefacts.sln, containing all projects related to ETW-related projects. -
Kernel-Telemetry-Drivers: located atC:\Kernel-Telemetry-Dev\Kernel-Telemetry-Drivers.sln, which includes all driver-related projects.
Note that this module assumes familiarity with WinDbg and the basics of Windows kernel debugging.
Utils.h Header Files
The development machine include both a user-mode and a kernel-mode version of a header file named utils.h.
- The user-mode version is located at
C:\Kernel-Telemetry-Dev\utility\user-mode\utils.h - The kernel-mode version is located at
C:\Kernel-Telemetry-Dev\utility\kernel-mode\utils.h
This header file contains all the utility functions, undocumented structure definitions, structure offsets, and third-party helpers required across all source code examples in this module.
It will be copied into each project and included at the beginning of the code examples:
#include "utils.h"
Windows Defender
Since this module analyzes both user-mode and kernel-mode components of Windows Defender, the antivirus is intentionally left enabled in the provided lab environments. As a result, it is recommended to disable real-time protection before conducting experiments with tools such as mimikatz.exe.
Exceptions have been configured for the folders C:\Kernel-Telemetry-Dev and C:\Kernel-Telemetry-Test, so transferring files into these directories will not trigger any alerts, even if Windows Defender is active.
Enabling Kernel Debugging on the Testing machine
You must follow the following steps in order to make the test machine's kernel debuggable.
- On the
DEVmachine, open WinDbg -> File -> Start Debugging -> Attach to kernel, then connect WinDbg via KDNET using port50000and the keyf.f.f.f:
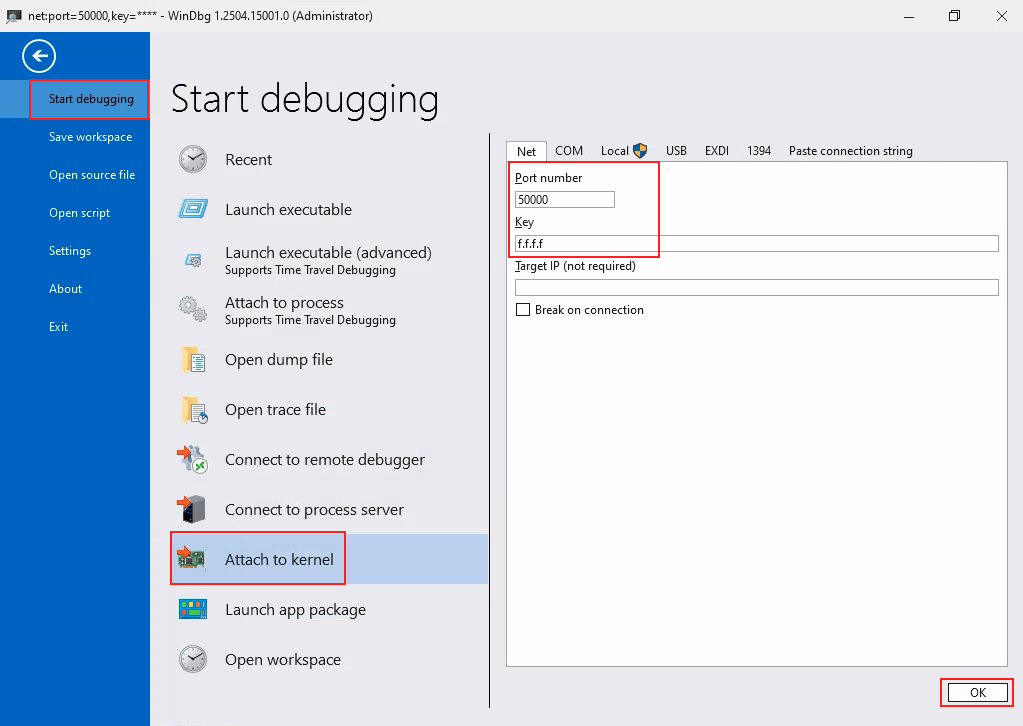
Once this is completed, WinDbg will enter a waiting state, as the TEST machine is not debuggable yet.
- On the
TESTmachine, enable debugging withbcdeditand restart the machine:
C:\> bcdedit /debug on

C:\> shutdown /r /t 0
- Once the
TESTmachine reboots, the first connection will take around 2-3 minutes to be established, this waiting time isnormal. After this delay, the debugger will display the output below. Up to this point, you still cannot connect to the test machine via RDP. This is expected, as the RDP service has not started yet.
************* Path validation summary **************
Response                         Time (ms)     Location
Deferred                                       srv*
Symbol search path is: srv*
Executable search path is:
Windows 10 Kernel Version 19041 MP (1 procs) Free x64
Edition build lab: 19041.1.amd64fre.vb_release.191206-1406
Kernel base = 0xfffff807`12600000 PsLoadedModuleList = 0xfffff807`1322a2b0
System Uptime: 0 days 0:01:09.620
- Then wait 2-3 minutes for the second connection to be established, i.e. until the message "Refreshing KD connection" appears:
<SNIP>
System Uptime: 0 days 0:01:09.620
KDTARGET: Refreshing KD connection
- Once this message appears, it means the test machine's kernel is
successfullybeing debugged. You can now connect to it via RDP.
Generally, the process of enabling debugging on the test machine takes between 5 and 8 minutes.
All debugging operations in this module will be conducted exclusively through remote debugging using KDNET, and you will not need to perform local debugging at any point.
Remote Kernel Debugging Output
Once the test machine is configured in debug mode and started, we can debug its kernel using WinDbg.
Kernel debugging needs to be enabled to view the output from our drivers (e.g., messages printed with DbgPrint). To do this, we simply set the KD_DEFAULT_MASK constant to 0xFF whenever we want to activate it:
0: kd> ed KD_DEFAULT_MASK 0xFF
To disable debugging output, we can reset the mask to 0 as follows:
0: kd> ed KD_DEFAULT_MASK 0x00
When designing kernel-mode drivers, we will often use DbgPrint to send messages to the debugger, such as displaying information about detected TTPs.
Note: If needed, the debugging symbols (PDB files) for the relevant modules are located under the C:\Symbols directory on the development machine.