Summary
Static analysis has many limitations when it comes to malware analysis and reverse engineering, especially as malware Tactics, Techniques, and Procedures (TTPs) evolve to maximize stealth and hide their activities. In this context, dynamic analysis has become a critical skill in the field of malware analysis. WinDbg stands out as the standard tool for debugging on Windows. This powerful debugger provides all the necessary tools to trace and analyze processes or the Windows operating system kernel at the most granular level, offering exceptional granularity and unique flexibility.
Through this module, we will cover the following topics:
- Getting started with WinDbg and mastering its basic commands
- Understanding LINQ methods in WinDbg for advanced data querying
- Analyzing and extracting code injections using dynamic analysis techniques
- Leveraging Time Travel Debugging (TTD) technology to dissect process behavior and extract payloads
- Introduction to kernel-mode debugging, including key concepts and structures like the Virtual Address Descriptor (VAD) Tree
- Exploring kernel debugging from a defensive perspective to uncover and counter Tactics, Techniques, and Procedures (TTPs) used in malicious or exploited drivers
- Utilizing JavaScript in WinDbg to design scripts for automating process data extraction and analysis tasks in both user and kernel modes
- Hands-on experience with debugging techniques to analyze stealth mechanisms and various TTPs, such as Process Hollowing methods
This module will provide a comprehensive understanding of WinDbg's capabilities, from basic usage to advanced debugging scenarios, while emphasizing practical applications for both offensive and defensive analysis. The module is accompanied by concrete use cases, examples, and challenges where students can let their creativity and acquired skills shine through.
To easily follow this module, the following prerequisites are highly recommended:
- Completion of
Intro to Assembly Language - Completion of
Introduction to Malware Analysis - Basic understanding of C/C++ and structures
- A general understanding of the Win32 API and an idea of how processes & threads work on Windows
- Basic understanding of the Portable Executable (PE) format and its components
Introduction to WinDbg
Debugger
A debugger is a software that helps developers analyze, test, and troubleshoot programs by allowing them to inspect and control the execution of code. It lets us pause execution, step through code line-by-line, inspect variables, and examine memory to identify bugs or understand program behavior. WinDbg, short for Windows Debugger, is a powerful debugger for Windows, widely used for both user-mode (application) and kernel-mode (operating system) debugging. The debugger attaches to a target, which could be a user-mode process (an application), a kernel (the operating system core), or a crash dump file. For a running process, the debugger uses Windows Debugging API such as DebugActiveProcess to hook into the process. For kernel debugging, it communicates with the OS kernel via specific protocols (e.g., network, serial cable, or local mode).
The diagram below shows the debugging modes. We have a Host Machine (running WinDbg) which attaches to a process’s memory and controlling execution. It can also perform local kernel debugging and remote kernel debugging on a target host.
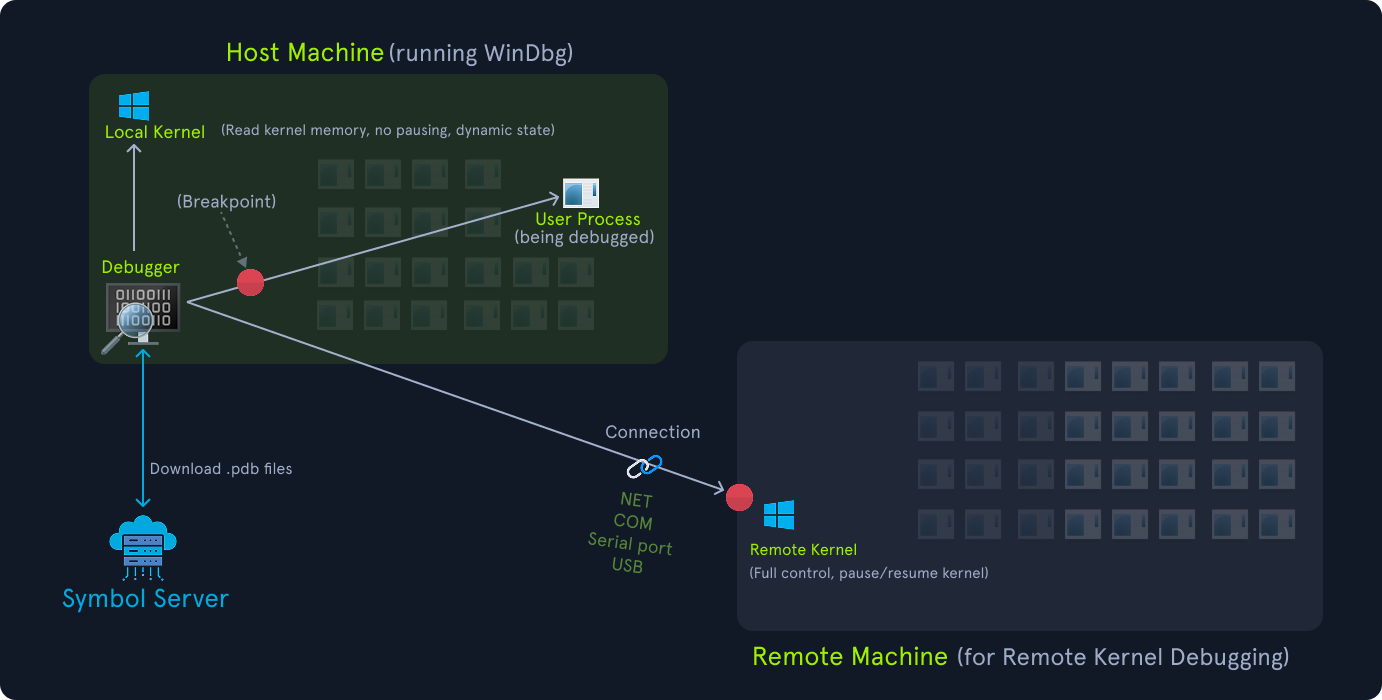
WinDbg uses Microsoft’s debugging engine (DbgEng.dll) and supports both user-mode and kernel-mode debugging. It provides a command-line interface (with commands like bp for breakpoints, g for go, k for stack trace) and a GUI for ease of use. It relies heavily on symbols (debug information in .pdb files) to map binary code to source code, making it easier to understand variables and functions.
WinDbg
WinDbg is the official debugger for the Windows operating system. It is developed and maintained by Microsoft. Beyond its traditional role in assisting developers of applications or drivers during their development, it has also become a useful tool for malware analysts, vulnerability researchers, exploit developers, and reverse engineers.
Although WinDbg has become the debugging standard on Windows, its older version featured a UI that evolved significantly over the debugger's versions but increasingly failed to provide user-friendly ergonomics over time, especially on recent Windows versions. The interface became somewhat outdated and cumbersome:
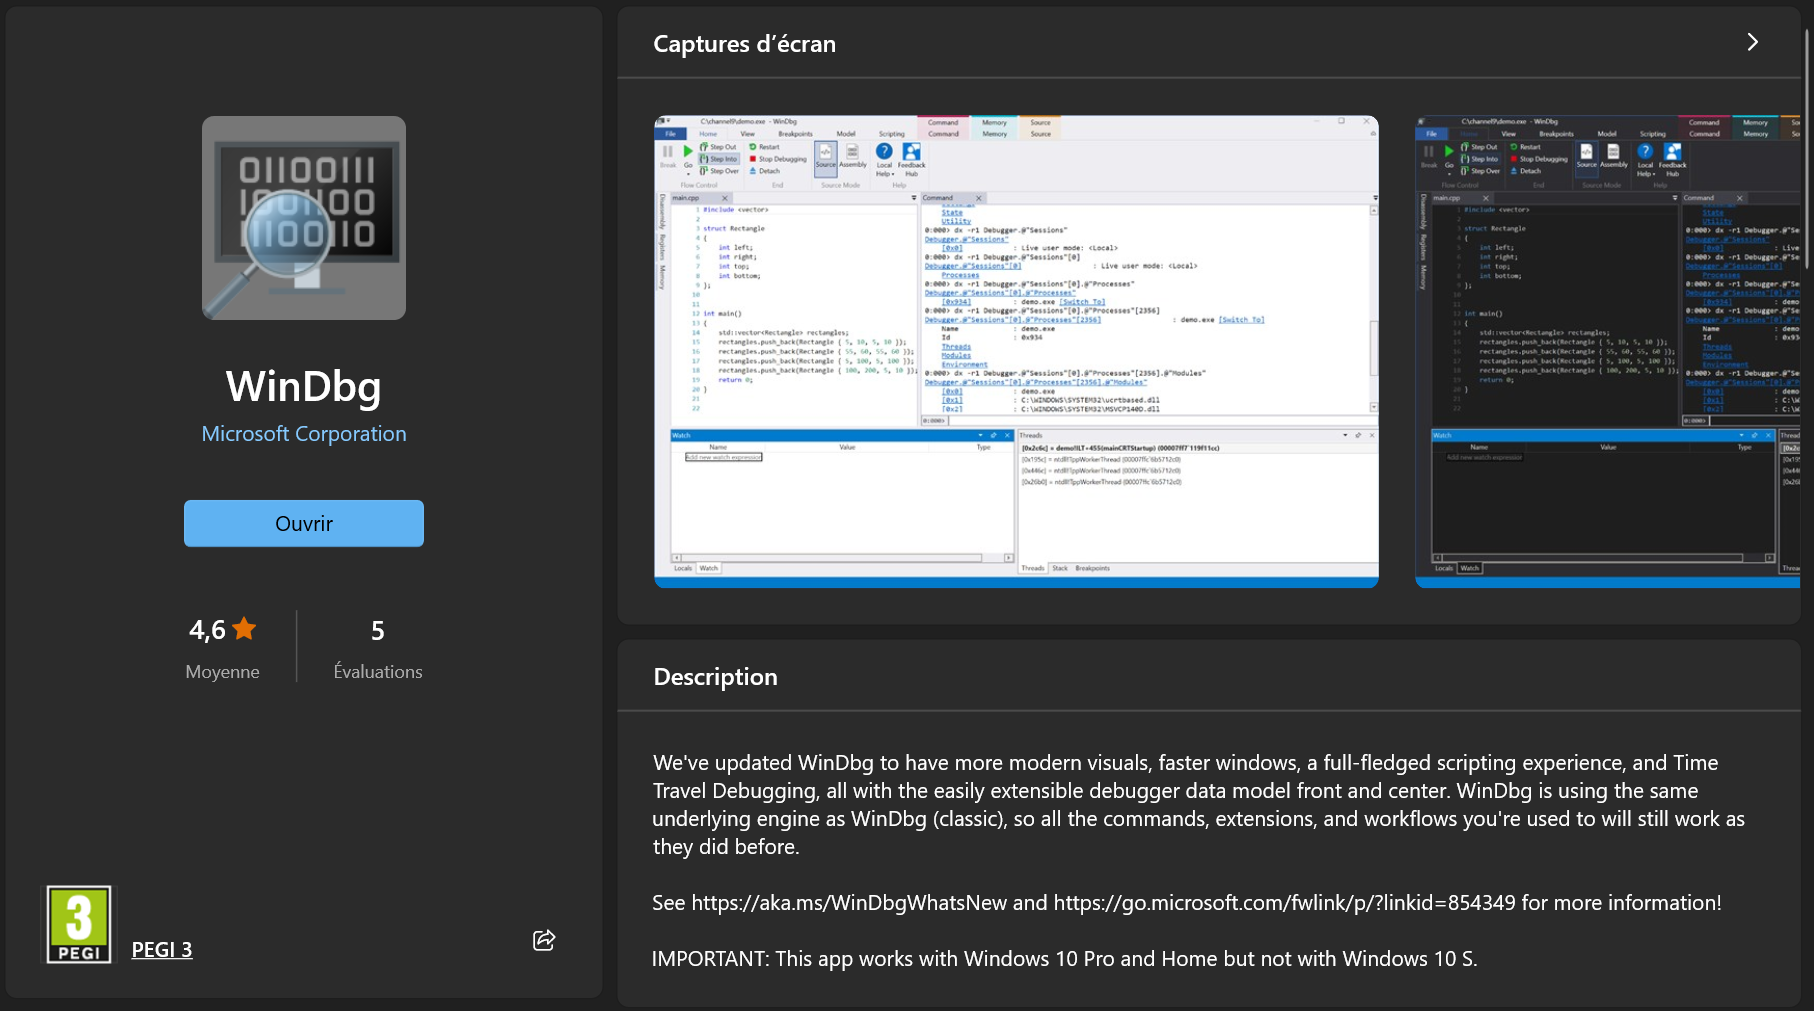
It is in this context that Microsoft completely overhauled the user interface by releasing WinDbgX, which is now the version referred to when discussing WinDbg:

Installing WinDbg
WinDbg can be installed either from the Microsoft Store or directly from the Microsoft website.
The graphical interface of WinDbg offers a comprehensive range of features organized intuitively to facilitate the debugging process. Let's explore some of the essential views offered by this GUI.
Selecting a Process to Debug
Let’s start from the beginning by choosing a process to debug. There are actually two ways to do this:
Launch a new process in debuggerAttach debugger to a running process
We'll see how this can be done.
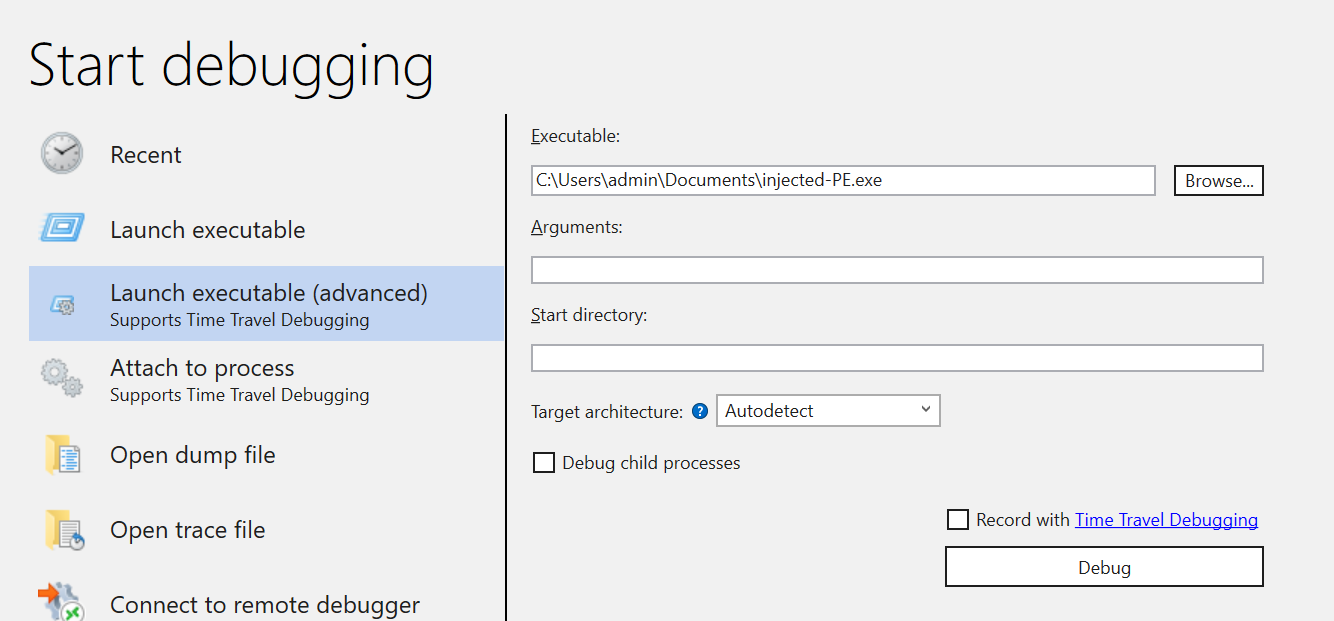
- We can create a process that will be automatically debugged from WinDbg. To do this, we can go to
File, select "Start Debugging", and choose between "Launch Executable" or "Launch Executable (Advanced)" for more parameters, including arguments, target architecture, and enabling Time Travel Debugging (more on this later).
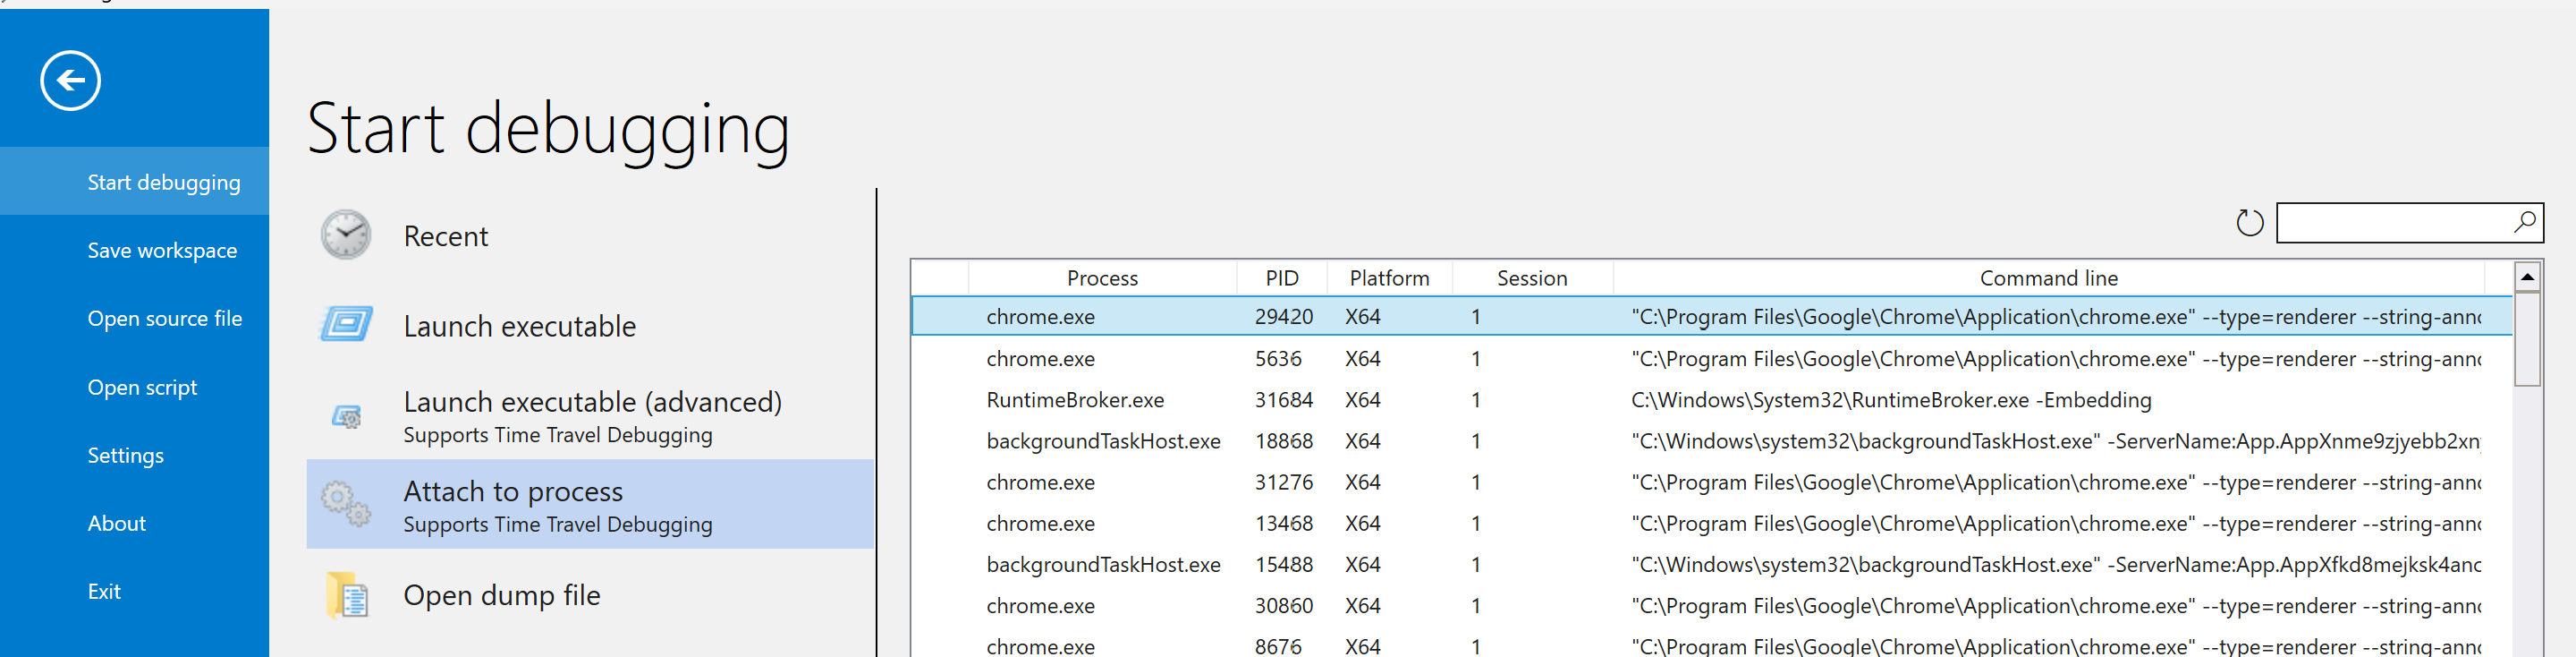
- We can also attach the debugger to a running process by selecting "
Attach to Process", which will pause the process and transfer control of its execution to the debugger.
If we choose to launch a process from the debugger, the debugger will position itself at the very beginning of the process initialization flow (i.e., at the level of LdrInitializeThunk) and take control:
When attaching the debugger to a running process, it will interrupt the process by invoking the DbgUiRemoteBreakin() function:
For any of the functions we will discuss later, more information about them can be obtained using the .hh command followed by the function name. In the following example, we will retrieve the documentation for the !address command:
We can use the .cls command to clear the console's contents.
We can stop the execution flow of a process being debugged by either pressing "Break" or using the Alt+Del combination. The execution flow can then be resumed with the g command:
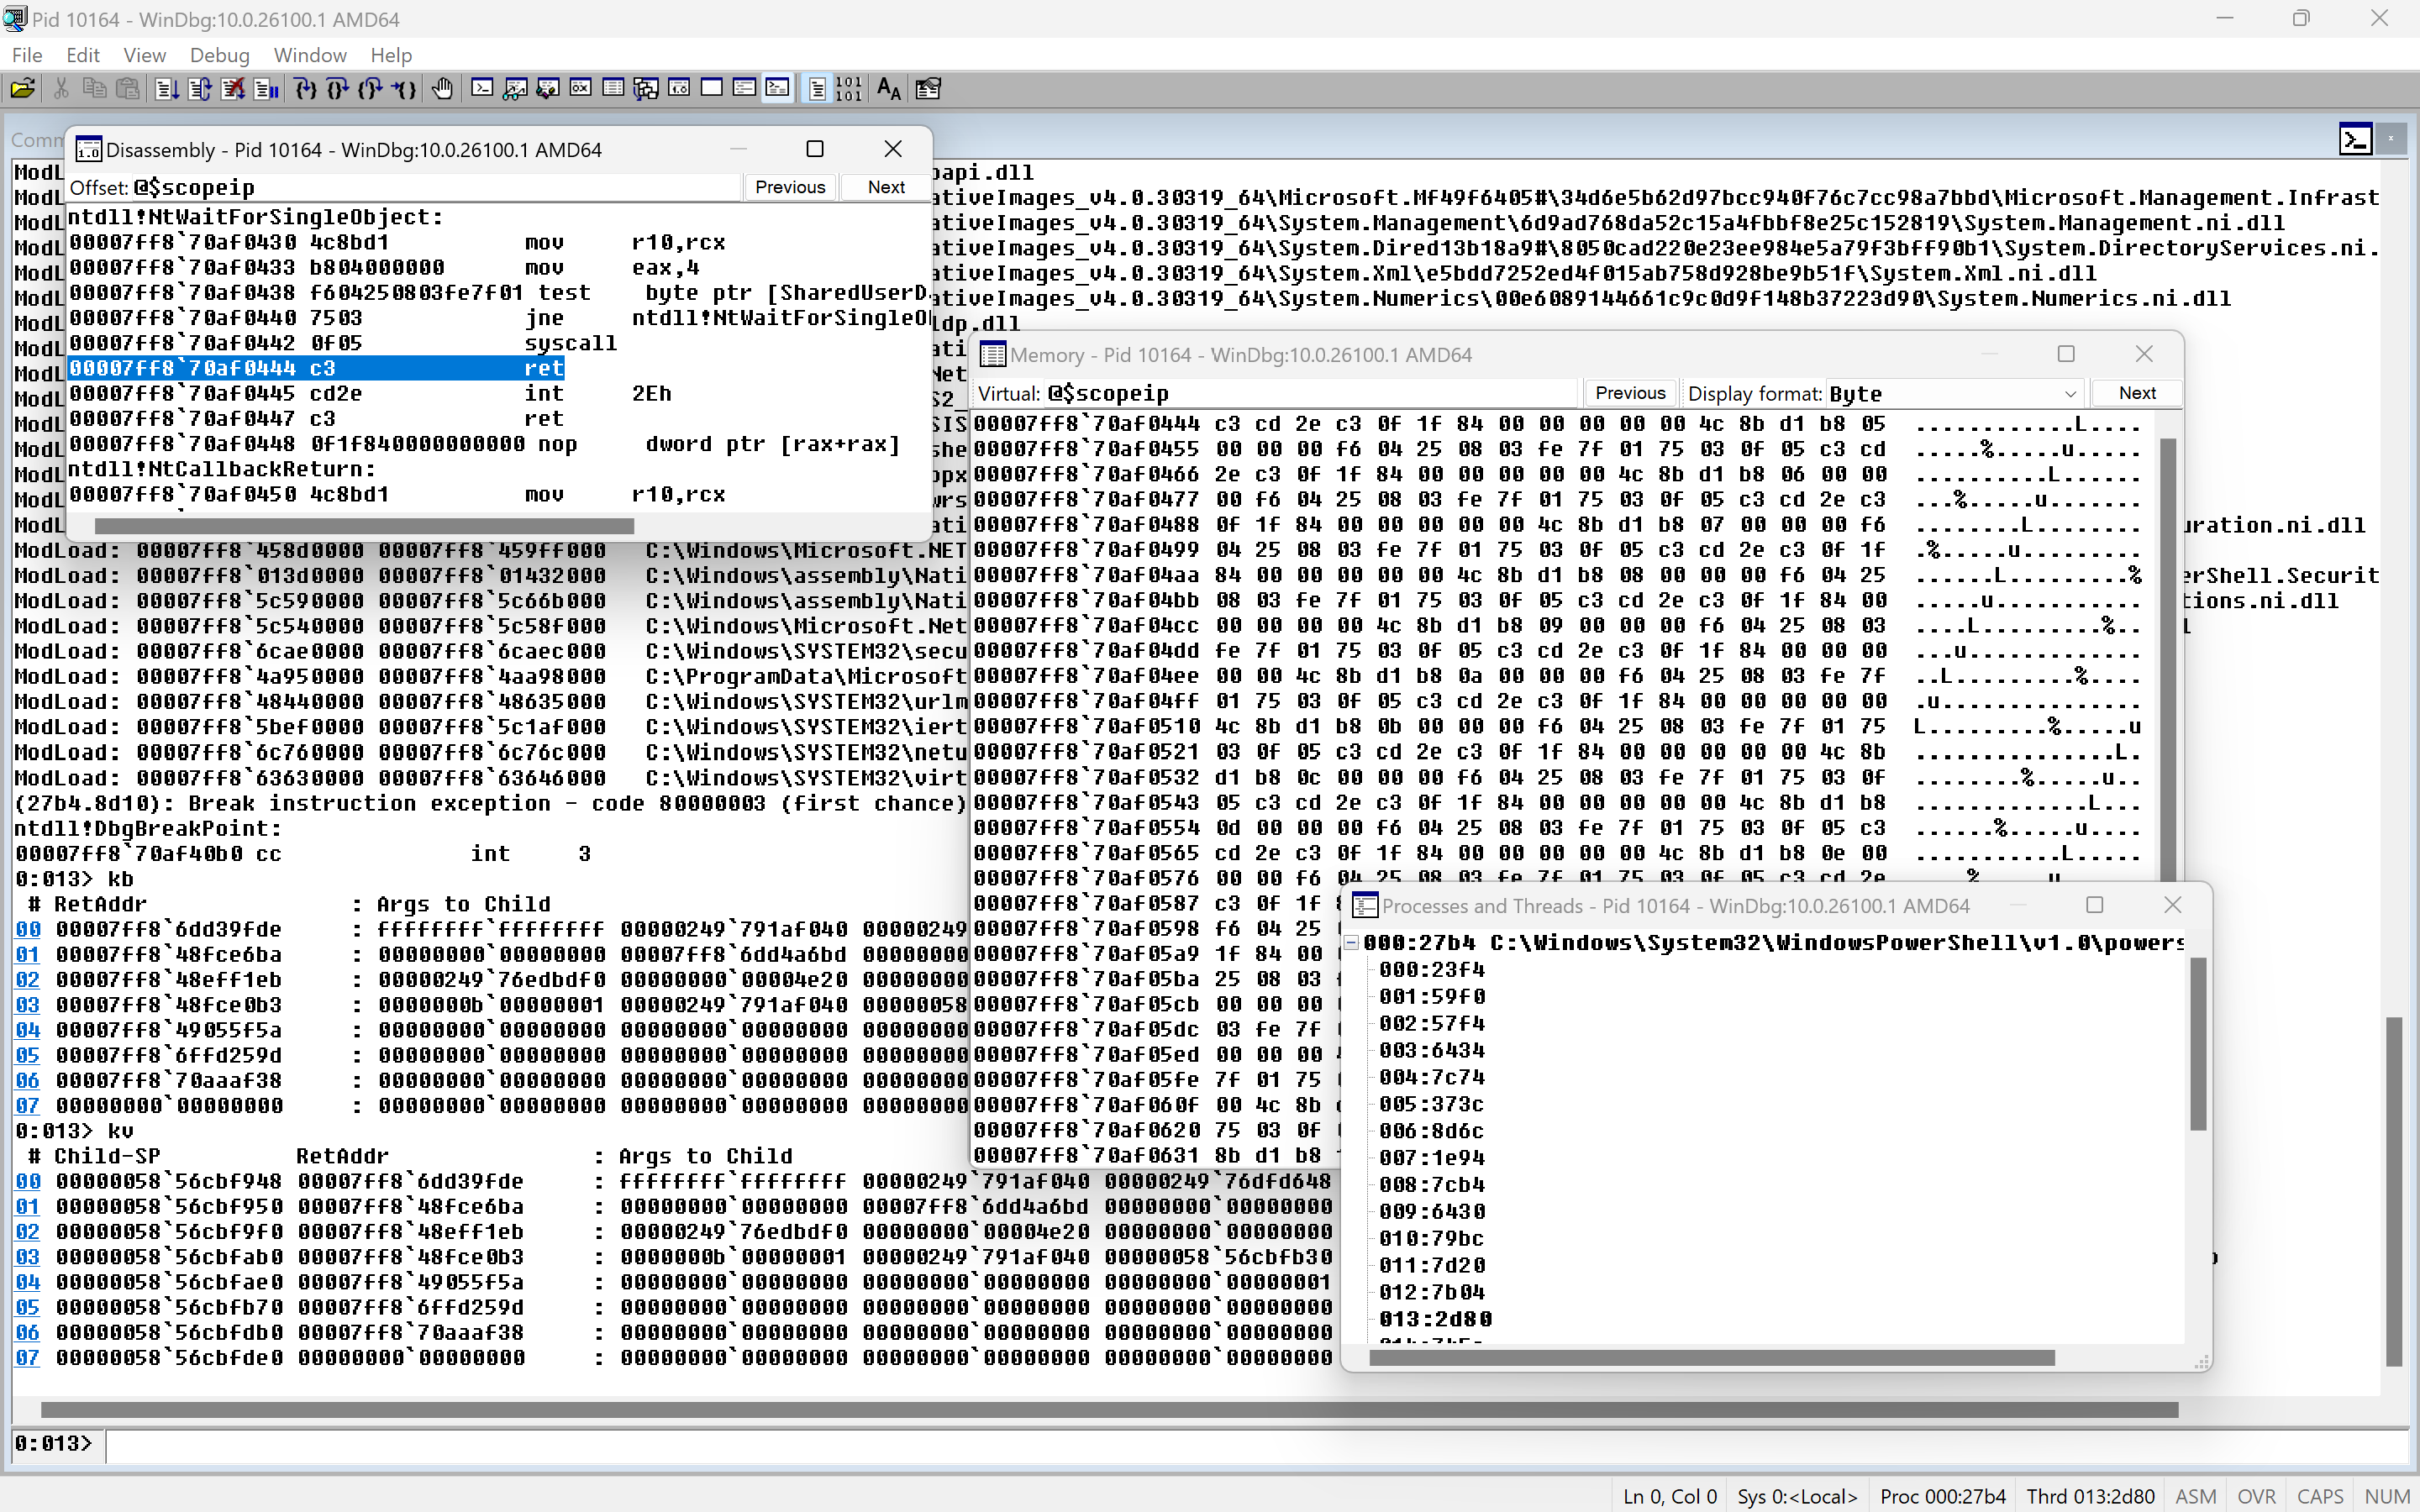
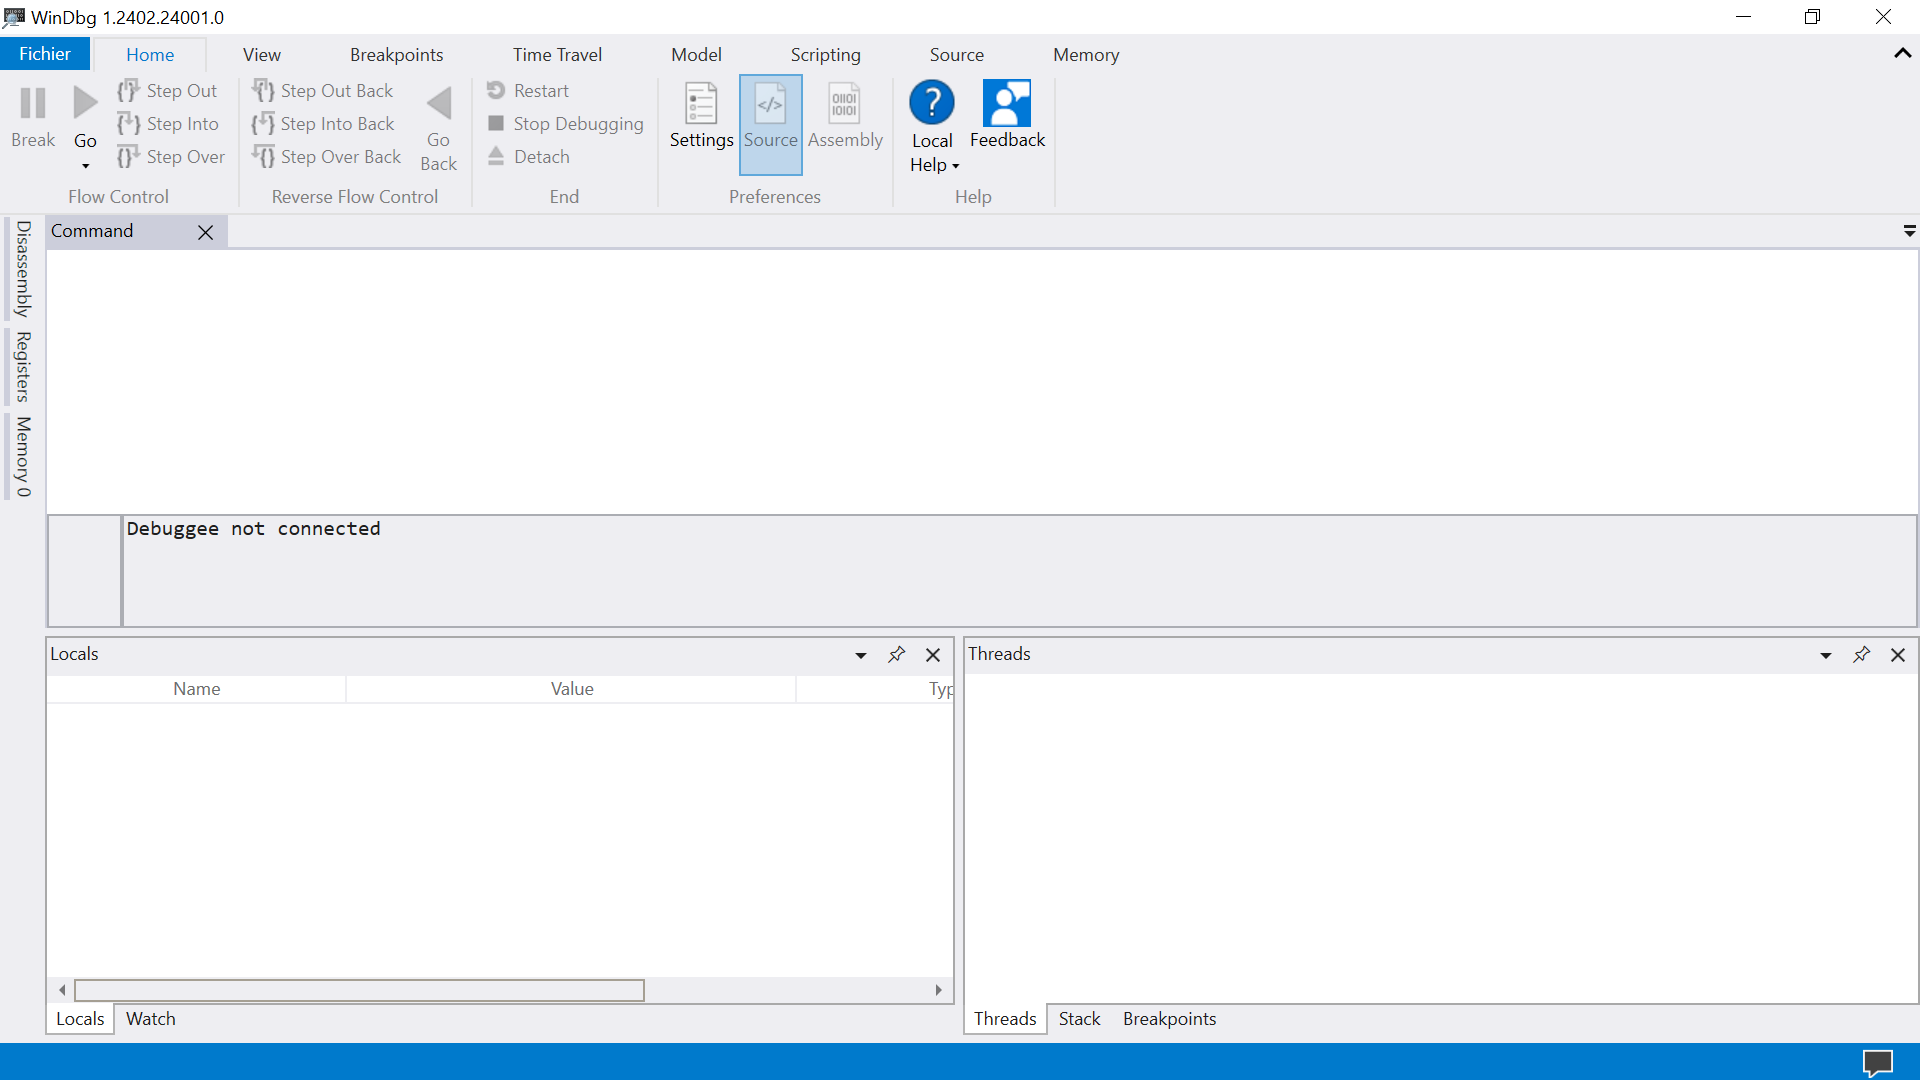
WinDbg Views
WinDbg is composed of different panes called "views", and each one of them serves a specific purpose in debugging a program. We will start off by explaining the views that we will be using.
-
Command View: This view is where we interact with the debugger through various commands and expressions that we will explore throughout this module.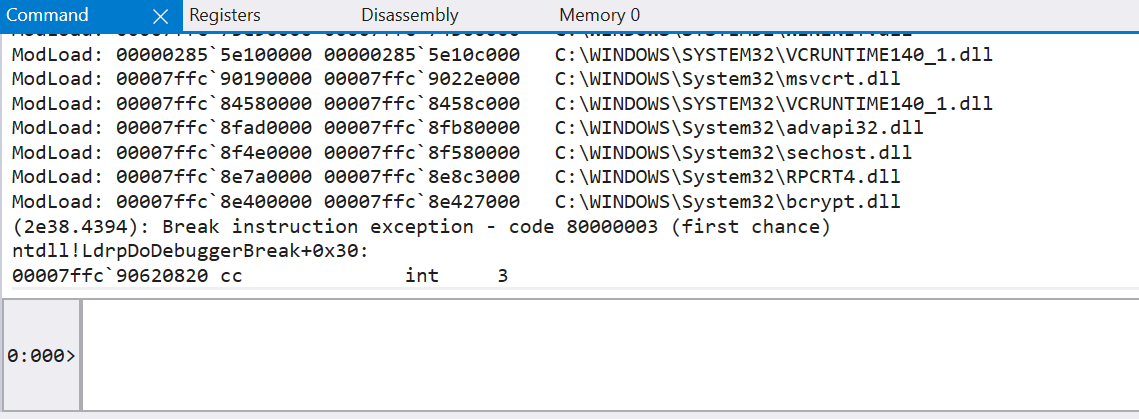
-
Registers View: It displays the state of the CPU registers for the current thread (we will later see how to switch threads). We can enable or disable the display of various register groups (User, SIMD, Floating Point, CET) by right-clicking.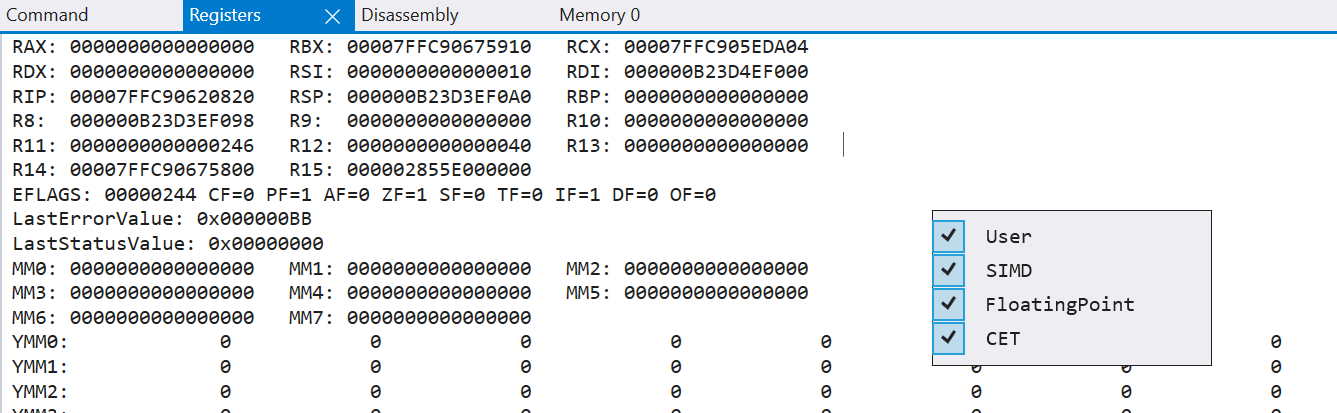
-
Disassembly View: It provides a view of the instructions executed by the execution flow of the program being debugged. @$scopeip is a variable that gives the address of the instruction pointer (RIP), or the address of the current instruction. However, we can also specify a different address.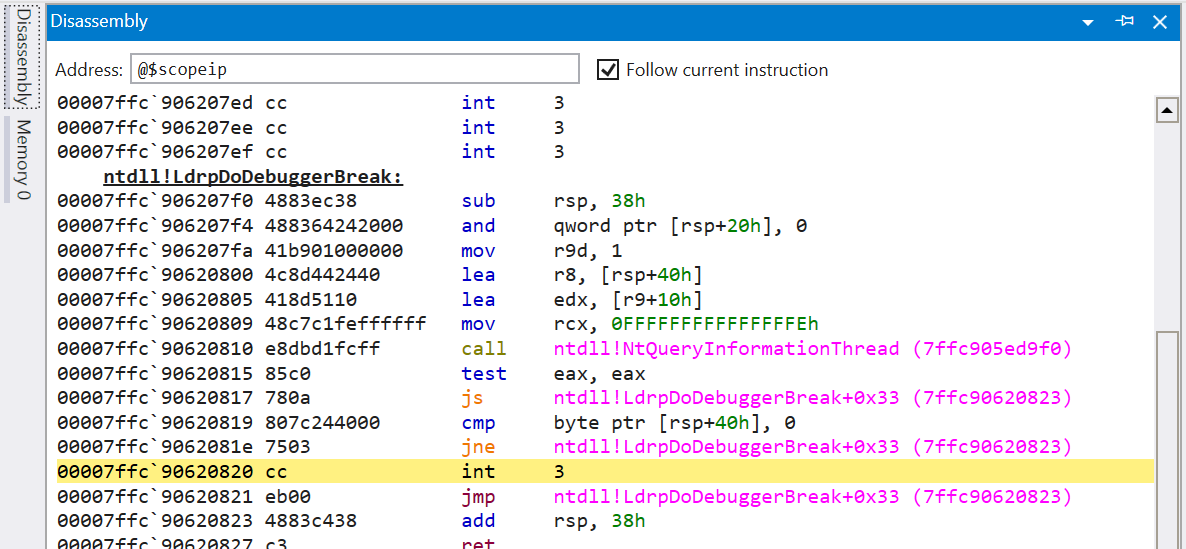
-
Threads View: It provides a list of the threads currently running in the debugged process. It also shows the current address where the execution flow of each thread is located.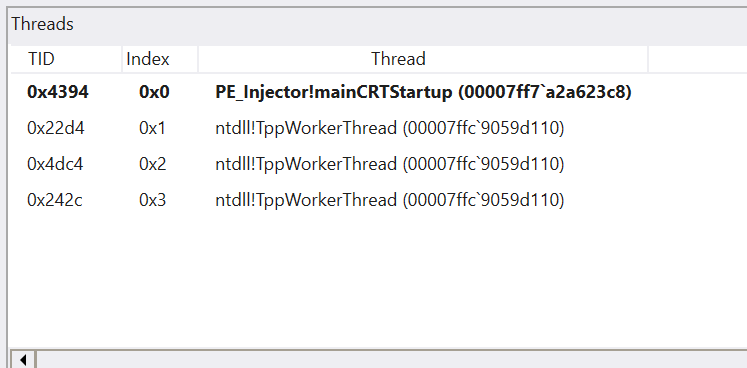
-
Call Stack View: It provides the call stack state of the current thread. It includes details such asChild-SP, which is the value of the stack pointer (RSP), as well as the address of the function to which the frame's RSP points.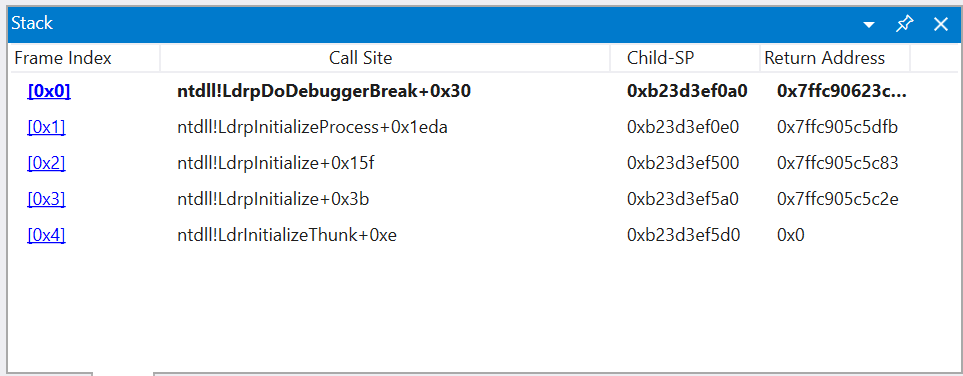
-
Memory View: It provides a view of the data contained in memory at a specific point during execution. We can specify an address, just like in the Disassembly View.
Debugging Symbols
Microsoft provides a public symbol server that hosts symbols for debugging purposes. These symbols are essential for debugging as they map memory addresses to meaningful names. If everything goes well, when launching a process or attaching to one, WinDbg automatically loads the symbol files from Microsoft's public server without requiring any manual intervention. We can use !sympath to check the Microsoft public server link:
0:013> !sympath

Symbol search path is: srv*;SRV*C:\Symbols*http://msdl.microsoft.com/download/symbols
Expanded Symbol search path is: cache*;SRV*https://msdl.microsoft.com/download/symbols;srv*c:\symbols*http://msdl.microsoft.com/download/symbols
We can search for specific function symbols using the x command, which accepts wildcards. Here, we're looking for all functions within ntdll.dll:
0:013> x ntdll!*

00007ff8`70a9aebc ntdll!RtlpHpVaMgrRangeCreate (void)
00007ff8`70ace3a0 ntdll!RtlFindLastBackwardRunClear (void)
<SNIP>
It is important to note that almost all structure symbols are prefixed with an underscore _. Therefore, we can search for all structures contained in ntdll.dll using the following command:
0:013> dt ntdll!_*

ntdll!_ARM64_FPCR_REG
ntdll!_ARM64_FPSR_REG
ntdll!_AMD64_MXCSR_REG
<SNIP>
We can also search for the closest symbol to a specific address using the ln command. For example, to find the symbol associated with the function containing the address 00007ff8'7014ef54:
0:013> ln 00007ff8`7014ef54

<SNIP>
(00007ff8`7014ef50)   USER32!CreateDialogParamW+0x4   |  (00007ff8`7014efe4)   USER32!xxxLBShowHideScrollBars
The ld command allows us to load the symbols for a specific module. Here, we are reloading the symbols for all modules:
0:013> ld *

Symbols already loaded for Microsoft_PowerShell_ConsoleHost_resources
Symbols already loaded for System_Management_Automation_resources
Symbols already loaded for mscorlib_resources
<SNIP>
The same action can be performed using the .reload command:
0:013> .reload

Reloading current modules
................................................................
In case of issues with symbols, we can reset the link to Microsoft's public symbol server using the .symfix command while specifying the directory where the symbols should be cached. By default, WinDbg uses C:\Symbols as the cache directory:
0:013> .symfix C:\Symbols
The files retrieved from Microsoft's public symbol server are PDB files, a type of file that contains various debugging information about a module. In the C:\Symbols\ directory, we will find all the PDB files downloaded from the public server. Each one of them is associated with a specific module:
C:\> dir C:\Symbols

17/02/202X  18:42    <DIR>          .
24/02/202X  13:01    <DIR>          advapi32.pdb
17/02/202X  18:38    <DIR>          apphelp.pdb
04/01/202X  18:15    <DIR>          apphost.pdb
09/02/202X  20:07    <DIR>          AsUpIO64.pdb
17/02/202X  18:36    <DIR>          bcrypt.pdb
17/02/202X  18:38    <DIR>          bcryptprimitives.pdb
13/11/202X  15:39    <DIR>          BTAGService.pdb
24/02/202X  13:01    <DIR>          combase.pdb
<SNIP>
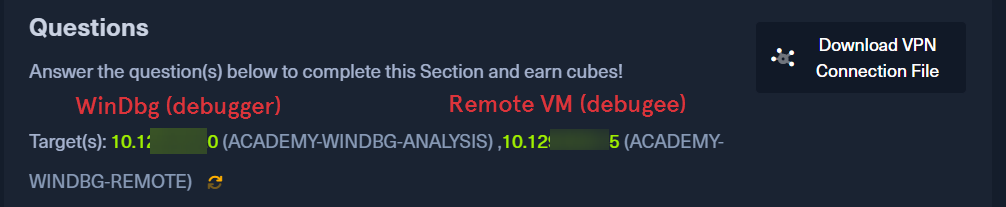
In this module, when we'll spawn the target (VM) in the interactive sections, we'll see two machines.
ACADEMY-WINDBG-ANALYSIS: This is the Main target (VM), where we'll perform debugging on applications/processes running on the local machine. Additionally, we'll debug the local Windows kernel on the same machine as WinDbg is running. We'll also perform the remote kernel debugging of the second machine from this VM.ACADEMY-WINDBG-REMOTE: This is the The remote system which needs to be booted with special debug settings. We'll use it for debugging the remote kernel of this remote system from our local machine (ACADEMY-WINDBG-ANALYSIS).