Summary
Malware has become an integral part of today's threat landscape, particularly in terms of defense. It has developed highly advanced methods that operate in memory rather than on disk, aiming to be as stealthy as possible and evade the traditional static signature-based detection mechanisms many antivirus software programs rely on. Therefore, it is necessary for detection mechanisms to evolve and adapt to malware whose offensive capabilities are continually expanding.
This module is intended for students looking to gain an introductory understanding of threat detection from a low-level user-mode perspective. It provides a first look at the Win32 API and how it is utilized for developing detection, which is technically and programmatically implemented in monitoring solutions that rely on user-mode-based dynamic analysis techniques to monitor process behavior, such as EDRs, scanners, and sandboxes.
This module focuses on the Windows NT environment, leveraging specific low-level Windows capabilities for threat detection. By the end of this module, you will be able to:
- Gain an in-depth understanding of the PE format structure from a dynamic analysis perspective.
- Discover the
user and kernel mode structuresinvolved in processes and threads, along with theircreation steps. - Craft and inject a
Dynamic Link Library (DLL)into a process to monitor its activity. - Intercept, instrument, redirect and analyze
system calls,function parametersand theirexecution context. - Unwind and analyze the
stack traceof a process's threads to identify potential threats. - Intercept, instrument and inspect
kernel returnsto user mode by leveraging undocumented concepts. - Detect suspicious
memory manipulationsand malicious patterns in memory`. - Detect and uncover potential
control-flow obfuscationtechniques. - Detect potential
evasion techniquesthat could bypass detection mechanisms. - Use a knowledge base of
Indicators of Compromiseto identify malicious patterns in intercepted function parameters.
The following prerequisites are highly recommended in order to easily follow this module:
- Completion of Intro to Assembly Language.
- Completion of YARA & Sigma for SOC Analysts.
- Completion of Process Injection Attacks and Detection.
- Basic understanding of C/C++, structures, and pointers.
Introduction
To gain insight into system behavior, a security solution can rely on a broad set of telemetry sources and observability tools that capture a wide spectrum of activities. This includes not only the internal operations of processes but also user behavior, inter-process interactions, system calls, and kernel-level events. These data points span various levels of abstraction, offering comprehensive coverage of how the system is used and potentially misused.
The interfaces, technologies, and tools listed below enable real-time collection of such data and form the foundation for building detection rules and logic tailored to identifying Techniques, Tactics, and Procedures (TTPs).
| Technology/Technique | Description |
|---|---|
Windows Management Instrumentation (WMI) |
High-level query interface for accessing real-time system information (e.g., running processes, installed software, network configuration). Widely used by administrators and monitoring and security tools, but also by attackers for reconnaissance. |
Sysmon |
Advanced telemetry tool from Sysinternals. Captures low-level system activity (process creation, image loading, registry changes, network connections, WMI activity, pipe access, named objects, etc.) and logs it to the Event Log via Event Tracing for Windows (ETW). Configurable via XML to filter or enrich events. Supports parent-child tracking and hashes. |
Windows Event Logs |
Centralized logging system (Application, Security, System). Captures standard OS and application events like logons, service changes, driver loading, policy changes, and errors. Accessible via Event Viewer or APIs. |
User-Mode API Hooking |
Intercepts user-mode APIs like CreateProcess, VirtualAlloc, and WriteProcessMemory by injecting custom DLLs, patching the Import Address Table (IAT), or applying inline hooks. Often used by debuggers, malware, and security products for redirection or behavior tracking. |
ETW (Event Tracing for Windows) |
High-performance logging framework built into Windows. Used by the kernel, system services, applications, and tools like Sysmon to emit telemetry. Supports real-time and file-based tracing. Can be consumed by tools like WPR, xperf, logman, or EDR agents. Acts as the backbone of many modern telemetry sources. |
Kernel-Mode ETW Providers |
Kernel providers emit events (e.g., process/thread/image load, memory, network, Threat-Intelligence). Supports real-time and recorded tracing. |
Security Auditing / Audit Policy |
When enabled, logs sensitive actions (e.g., logons, object access, policy changes) into the Security log. |
Hypervisor-Based Monitoring |
Uses virtualization extensions (Intel VT-x, AMD-V) to monitor kernel-level events from outside the guest OS. Employed by advanced EDRs or sandbox platforms. |
MiniFilter Drivers |
File system filter drivers intercept file I/O operations. Used in EDRs, AVs, Data Leak Prevention (DLP) tools, and ransomware protection solutions. |
Kernel Callbacks |
This type of callback allow drivers or the operating system to be notified when certain system-level events occur, such as process creation, thread creation, image loading, registry access, or object handle operations. Its purpose is to let kernel-mode components (like antivirus or monitoring drivers) observe or intercept these events in real time without needing to constantly poll the system. |
Throughout this module, we will focus on user-mode API hooking and the detection techniques associated with it, including kernel return instrumentation. We will explore the complete set of documented and undocumented methods offered by Windows and the Win32 API to intercept and instrument function calls. These mechanisms will be used to assess how observable and detectable such activities are from a defensive standpoint.
API interception is largely considered the most powerful form of telemetry collection as it provides the deepest insights into how applications interact with the operating system. It has also historically been the most common user-mode telemetry approach used by endpoint security solutions such as EDRs. By hooking into critical user-mode functions, a security product can monitor sensitive operations in real time, such as memory allocation, process creation, file access, and network communication.
The Windows Kernel Telemetry & Detection Techniques module on HTB Academy focuses on implementing detection mechanisms from a kernel-level perspective. It notably explores kernel callbacks, filtering drivers, kernel-mode ETW providers, and kernel-level system call hooking.
However, monitoring API hooking from user mode comes with inherent limitations. By design, the user-mode abstraction level cannot be fully trusted, making it vulnerable to various evasion techniques. As we progress through this module, we will examine the various strategies attackers use to evade function call interception mechanisms deployed for defensive purposes. We will then explore how to implement defensive measures (artifacts) to identify and respond to these evasion attempts.
Dynamic-Link Libraries (DLLs)
Dynamic-link libraries (DLLs) are modules that contain functions and data used by multiple applications simultaneously, promoting modularity and efficient memory usage. Unlike static libraries (.lib files), which are linked into an application's executable at compile time, DLLs are loaded at runtime, allowing for shared code among programs and smaller executable sizes.
Modifying a process's executable code to change its behavior is often very difficult or even impossible in some cases. Therefore, to alter a program's behavior at runtime for defensive purposes, such as redirecting certain function calls to our own analysis functions, we create DLLs that will be injected into the target process. Since DLLs are mapped into the process's virtual memory space, once injected, they have access to the entire virtual memory space of that process. This allows them to control that memory space by modifying protections on certain regions using functions like VirtualProtectEx without requiring special privileges.
Defensive DLLs are typically injected using a method called Kernel APC (Asynchronous Procedure Call) injection, which leverages kernel-mode drivers. This technique allows the driver to queue a special APC to a targeted user-mode thread, causing the DLL to be loaded stealthily within the context of that thread. Kernel APC injection is favored in defensive scenarios because it operates at a very low level in the system, making it harder for malicious software to detect or block the injection process.
Here, we will simulate DLL injection on process creation/runtime using InjectDll.exe. All the detection techniques we implement will be contained within the DLLs that we inject through InjectDll.exe:
C:\>InjectDll.exe
Usage:
  /run /pid <PID> /dllpath <DLL>
  /create /path <EXE_PATH> /dllpath <DLL>
  [Optional] /yara
In the following example, InjectDll.exe is used to inject the ToInject.dll DLL into the running process with PID 7493:
C:\>InjectDll.exe /run /pid 7493 /dllpath C:\Path\To\Dll\ToInject.dll
InjectDll.exe is used to create a process named Artifact.exe and inject the ToInject.dll into it. Note the use of the /yara flag, which instructs InjectDll.exe to first inject the dependencies required by the YARA library in order to enable the usage of its features.
C:\>InjectDll.exe /create /pid C:\Patg\To\Artifact.exe /dllpath C:\Path\To\Dll\ToInject.dll /yara
At certain points, we will use the YARA interface to search for patterns within the buffers processed by the functions we intercept.
Creating a Dynamic Link Library in Visual Studio
We will use Visual Studio as the IDE throughout this module. Each Visual Studio project corresponds to a DLL or another executable. A Visual Studio solution contains multiple projects.
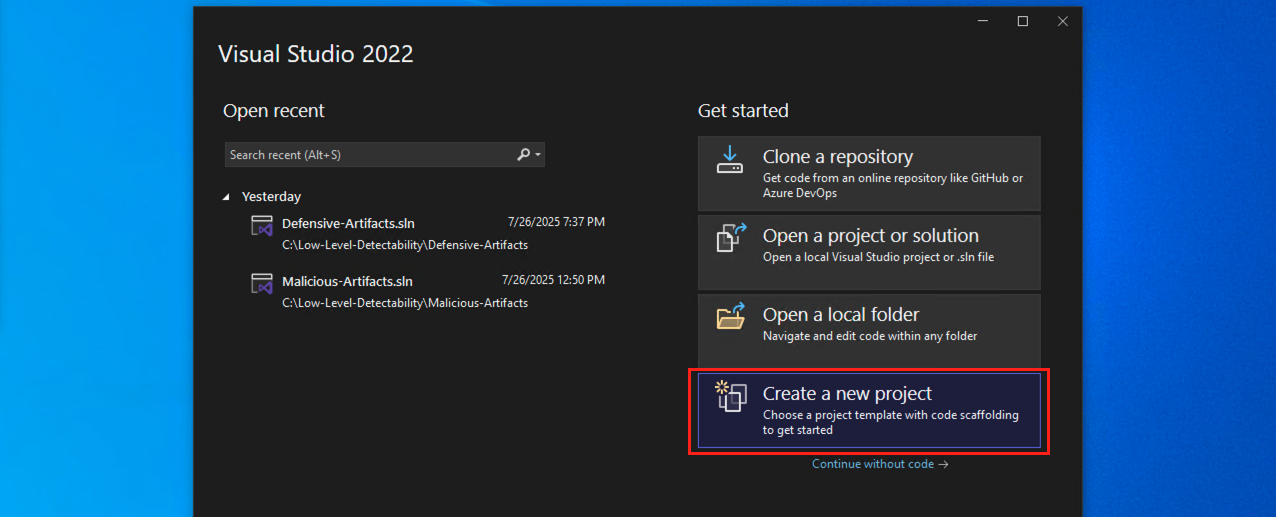
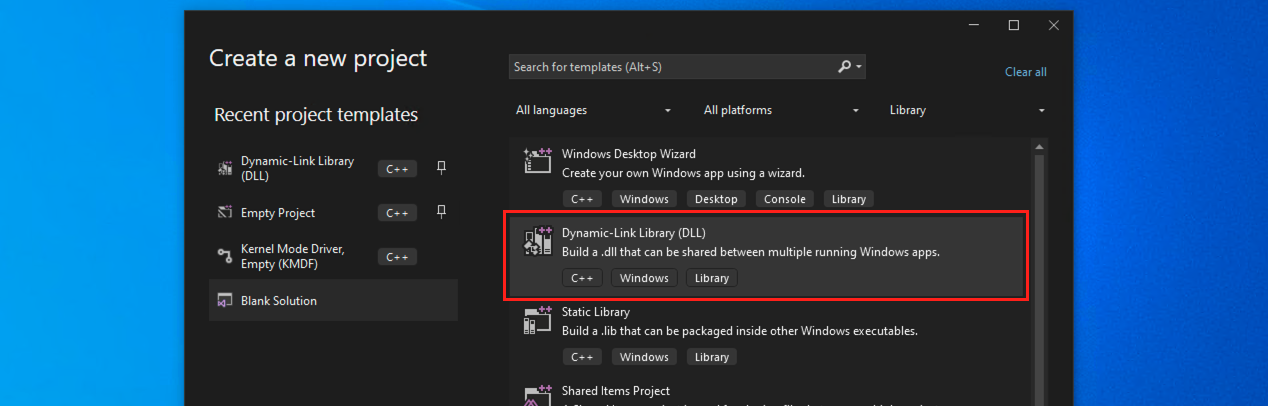
To create a Dynamic-Link Library project in Visual Studio, select "Create a new project" and search for "Dynamic-Link Library (DLL)".
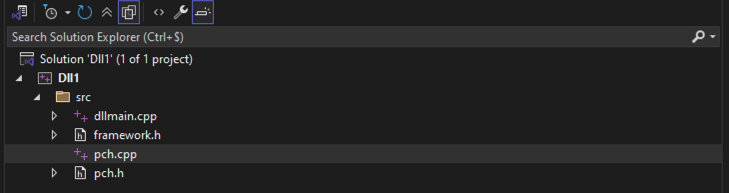
Once the DLL is created, Visual Studio will generate the following project structure.
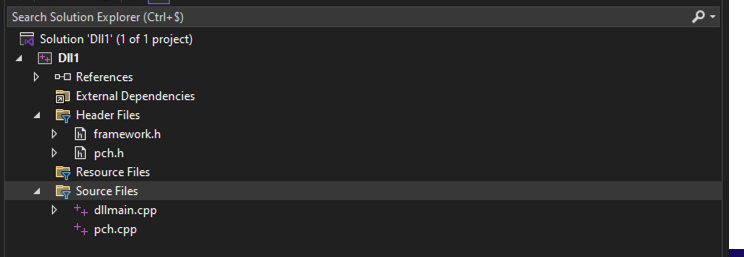
In reality, the four generated files are not placed in any folder; they are simply represented that way visually.
We can choose to organize our source files by placing them in a folder named src. To do this, select the "Show All Files" icon.
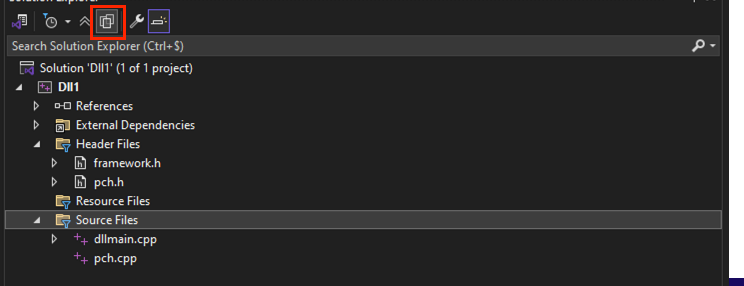
Then, right-click on the project, select "Add", choose "New Folder", name it src, and drag all the files into this new src folder:
You can also create a new project within an existing solution or from an empty one by right-clicking on the solution name and selecting Add → New Project.
Attach Reasons
The file dllmain.cpp serves as the DLL's entry point. This entry point typically handles four types of attachment reasons:
// dllmain.cpp : Defines the entry point for the DLL application.
#include "pch.h"

BOOL APIENTRY DllMain( HMODULE hModule,
                       DWORD  ul_reason_for_call,
                       LPVOID lpReserved
                     )
{
    switch (ul_reason_for_call)
    {
    case DLL_PROCESS_ATTACH:
    case DLL_THREAD_ATTACH:
    case DLL_THREAD_DETACH:
    case DLL_PROCESS_DETACH:
        break;
    }
    return TRUE;
}
The table below explains the purpose of each of these attachment reasons.
| Reason | Description | |
|---|---|---|
DLL_PROCESS_ATTACH |
The DLL is being loaded into the virtual address space of the current process, either during process startup or via a call to LoadLibrary. This is an opportunity to initialize any instance data or allocate resources needed by the DLL. |
|
DLL_THREAD_ATTACH |
A new thread is being created in the current process. The system calls the DLL's entry point function so that the DLL can allocate resources for the new thread, such as thread-local storage (TLS). | |
DLL_THREAD_DETACH |
A thread is exiting cleanly. The DLL can use this notification to free resources allocated for the thread, such as TLS data. | |
DLL_PROCESS_DETACH |
The DLL is being unloaded from the virtual address space of the calling process, either due to process termination or a call to FreeLibrary. The DLL should use this opportunity to clean up all resources allocated for the process. |
DLL Compilation
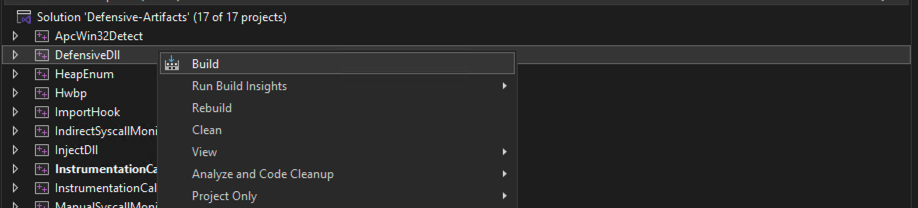
To compile a DLL or any project meant to generate an executable, simply right-click on the project and select "Build".
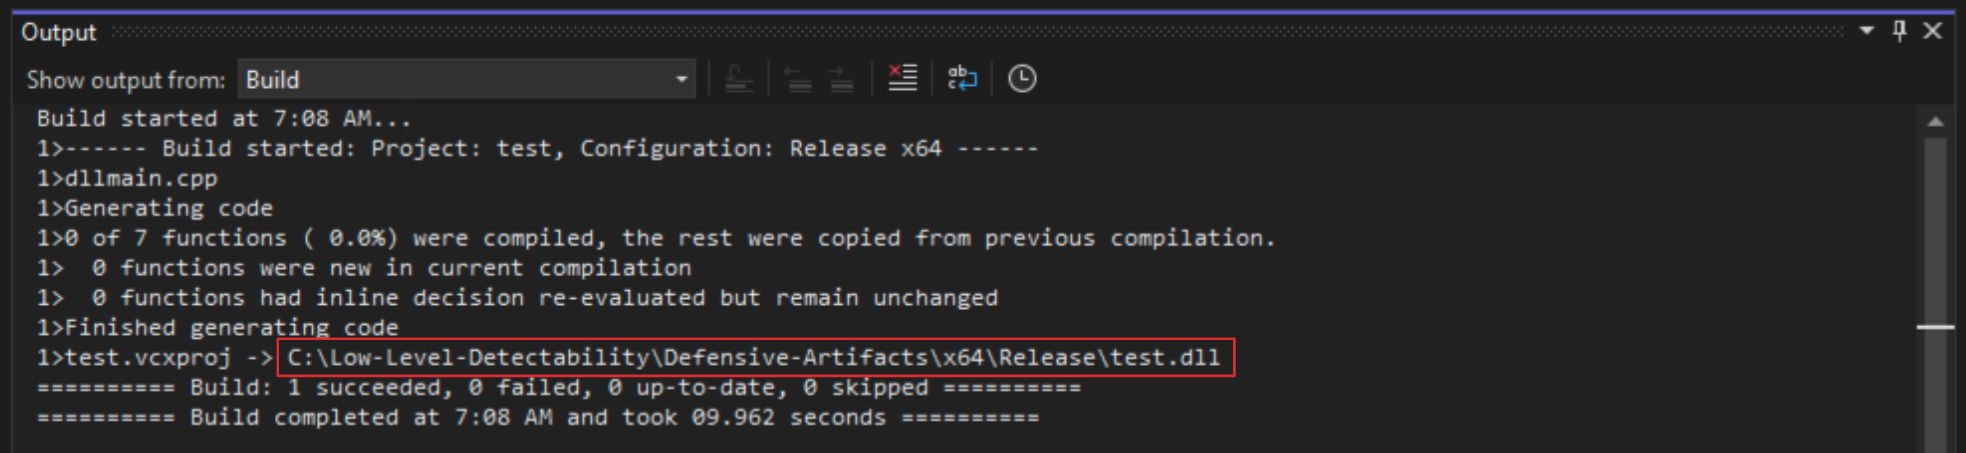
After successful compilation, the Visual Studio output console displays the path where the compiled DLL has been generated:
Precompiled Headers
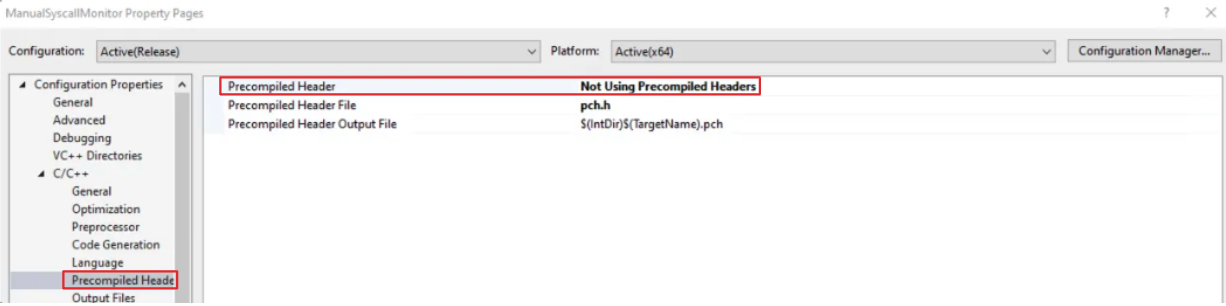
In Visual Studio DLL projects, precompiled headers are enabled by default to improve build efficiency by preventing repeated compilation of the same headers across different source files. The file pch.h serves as the designated header that must be included in our source files to utilize these precompiled headers. If we omit including pch.h, the compiler will generate an error of type "unexpected end of file while looking for precompiled header". To prevent this, we can disable precompiled headers in our project settings, which removes the requirement to include pch.h in our source files.
Afterward, you can delete the files generated by Visual Studio and keep only dllmain.cpp.
Module's Lab
A Windows 10 22H2 machine is provided with this module. It includes all the tools and artifacts used throughout the module, organized in the folder C:\Low-Level-Detectability.
📁 C:\Low-Level-Detectability\
	📁 Defensive-Artifacts (Visual Studio Solution)
		📁 DefensiveDll
			📁 src
		📁 IndirectSyscallMonitor
			📁 src
	📁 Malicious-Artifacts (Visual Studio Solution)
		📁 ApcQueueInject
			📁 src
		📁 CommandLineSpoof
			📁 src
	📁 Compiled
	📁 Dependencies
	📁 Challenges
	📁 Skills-Assessment
-
Defensive-Artifacts: Visual Studio solution containing all the defensive DLL projects. -
Malicious-Artifacts: Visual Studio solution with artifacts used to test detection techniques. -
Compiled: Contains the compiled.exeand.dllfiles from all the projects in the two solutions mentioned above. -
Challenges: Contains the executables to use in the various challenges/exercises. -
Skills-Assessment: Contains the artifact to use in the final Skills Assessment.
Microsoft Documentation
The Microsoft documentation on the Win32 API will be our best ally throughout this module. Do not hesitate to look up the definition or purpose of any Win32 API function we use or any related structure.
Undocumented Structures/Functions Resources
We will also use undocumented functions and structures throughout this module. Several notable resources provide detailed information on these undocumented elements:
- The Vergilius Project: an online resource that offers a comprehensive collection of Microsoft Windows kernel structures, unions, and enumerations, many of which are undocumented and not found in the Windows Driver Kit (WDK) headers.
- NtDoc: A community-driven collection of information about Native API functions and internal NT structures, often extracted from reverse engineering efforts and symbol analysis.
- Geoff Chappell’s Windows Documentation: An in-depth exploration of undocumented Windows behavior and internal APIs, compiled from years of research.
- ReactOS Source Code: An open-source Windows-compatible operating system whose source code offers valuable insights into undocumented behavior and implementation details of Windows internals.
-
Windows symbol files (PDBs): While not a standalone resource, loading symbol files with tools like WinDbg can reveal internal structure layouts and function names, even for undocumented components.
WinDbg
WinDbg is a powerful Windows debugger used for analyzing and troubleshooting both user-mode and kernel-mode software. We will use WinDbg as the main debugger for the basic debugging tasks we will perform on the kernel, processes, and threads. WinDbg is included in the lab provided with this module.
Debugging a running process
To debug a running process, open the File menu, select "Attach to Process", and enter either the process ID or its name in the search bar to locate and attach to it.
Starting a process from WinDbg
To start debugging a process from WinDbg, go to File, then Start debugging, select Attach to process, choose Launch executable or Launch executable (advanced), and then locate the process we want to debug.
The HTB Academy module Introduction to Dynamic Analysis with WinDbg provides a complete overview of how to use WinDbg in both user mode and kernel mode for detecting malware and rootkits behavior.